Skip to content

Where to Invest in Jacksonville: A Guide for DFW Investors

Jacksonville is worth a serious look if you already invest in Dallas-Fort Worth and want a second market. It is growing, it has a diverse employer base, and its rents sit at a level that can work for single-family and multifamily buyers. The best places to start are the established in-town neighborhoods, the suburban rings in Duval, Clay and St. Johns counties, and the beach communities, each with a different tenant and a different risk profile. This guide covers the data, the areas, the property types and the Florida-specific costs you need to price before you buy.

Aubenrealty
Manage Your Jacksonville Investment
Auben Realty provides property management, renovation, and tenant placement for owners and investors across its regional markets.

Visit Auben Realty

TL;DR

  • Jacksonville’s population grew nearly 10% from 2020 to 2024, with job gains in manufacturing, healthcare, and transportation and warehousing.
  • Multifamily rents averaged $1,470 a month in Q2 2026, with occupancy near 90.9%.
  • Match the area to your goal: in-town neighborhoods for appreciation and renovation plays, suburbs for family rentals, beaches for premium rents and higher exposure to weather.
  • Underwrite insurance and wind mitigation before you make an offer. Florida carries costs a Texas investor does not expect.
  • Remote ownership works when you have local management, local maintenance and a local acquisition partner.

Table of Contents

Why DFW investors look at Jacksonville

DFW investors know what a fast-growing metro looks like: new employers, new rooftops, and competition for every decent deal. Many of them also know that the best DFW deals have become harder to underwrite as prices and competition rose. Jacksonville offers a similar growth story in a different regional economy, which is exactly what diversification is meant to do.

There is a second reason. A single-market portfolio carries single-market risks: one state’s tax regime, one set of property tax appraisal cycles, one local economy. Adding a Florida market spreads those risks. It also adds new ones, which we cover below, so the decision is a trade rather than a free win.

We operate in both places. Auben manages and invests across 10 regional markets, including Fort Worth and Dallas-Fort Worth in Texas and Jacksonville and Jacksonville Beach in Florida. We wrote about how Jacksonville cap rates look from a Fort Worth desk, and that comparison is the lens for this guide.

What the data says about Jacksonville demand

Start with the demand drivers, because rent growth and occupancy follow people and paychecks.

Indicator Figure Source
City population, July 1, 2025 1,017,689 U.S. Census Bureau
Median household income, 2020-2024 $69,872 U.S. Census Bureau
Metro unemployment rate, August 2026 4.3% U.S. Bureau of Labor Statistics
Total nonfarm employment, August 2026 803.8 thousand U.S. Bureau of Labor Statistics
Multifamily average rent, Q2 2026 $1,470 per month Cushman & Wakefield MarketBeat
Multifamily occupancy, Q2 2026 About 90.9% Cushman & Wakefield MarketBeat

Two readings matter. First, the growth is real, but the labor market has cooled: the Atlanta Fed reports that employers described flat hiring in 2025 as conditions moderated. Second, occupancy near 91% in multifamily, alongside a slowdown in new development compared with recent years, tells you the supply wave is easing. For a buyer that is a better entry point than a market in the middle of a construction peak, though it also means you should not underwrite aggressive rent jumps.

Public and private capital is also pushing into the urban core. The Jacksonville Business Journal points to projects such as the Stadium of the Future, a Four Seasons hotel and residences, and the Pearl Square and Gateway Jax developments as part of a cycle where large commitments build confidence and draw more private investment. For investors, that supports the case for neighborhoods within reach of downtown. It does not guarantee any single address will benefit, so treat it as a tailwind and underwrite the property on its own numbers.

Where to invest in Jacksonville: areas to evaluate

Jacksonville is geographically huge, and neighborhood quality changes block by block. Think in four buckets rather than a single citywide average. We describe the character of each below; pull current price, rent and days-on-market data for any specific ZIP code before you commit.

In-town neighborhoods near downtown

Riverside, Avondale, San Marco and the neighborhoods around them offer older housing stock, walkable commercial streets and proximity to the downtown projects described above. This is where renovation strategies tend to fit: older homes that benefit from a managed scope of work, then a lease to a renter who values location. Expect higher per-square-foot prices, historic character and more maintenance surprises in older construction. A renovation budget with a real contingency is not optional here.

Southside and Mandarin

The Southside corridor and Mandarin are suburban, convenient to employers, hospitals and shopping, and home to a large share of the area’s apartment communities and newer single-family neighborhoods. These areas typically attract renters who need a commute and a school zone, which supports steady demand for three- and four-bedroom homes. For DFW investors used to Plano or Frisco-style suburban renters, this will feel familiar.

Westside, Northside and Clay County

The Westside, the Northside and communities toward Orange Park in Clay County are where entry prices are generally lower and newer subdivisions and build-to-rent communities are more common. The Atlanta Fed notes job growth in transportation and warehousing, and the logistics employers behind that growth tend to draw workers to these parts of the metro. Lower entry price can mean thinner margins for error on vacancy and repairs, so underwriting discipline matters more.

Jacksonville Beach and the coast

The beaches carry premium rents and strong lifestyle demand. Our own market write-up on Jacksonville Beach rentals puts the average at $1,614 and covers what moves that number. Coastal addresses also bring higher insurance exposure, flood-zone questions and wind-mitigation costs. A beach property can be a strong asset when the insurance quote is in your spreadsheet from day one.

For a closer look at how we see the metro, our Jacksonville market page and the end-of-2025 market overview are good next reads.
Jacksonville Beach and the coast

Property types and strategies that fit different goals

The right place depends on what you want the property to do.

  • Cash flow with low involvement: newer single-family homes in suburban Duval and Clay county neighborhoods, managed professionally, aimed at long-term family tenants.
  • Appreciation plus value-add: older in-town homes bought below their potential and renovated under a controlled scope. This strategy rewards owners who do not manage the contractors themselves.
  • Scale: small multifamily or build-to-rent communities, where operating efficiency and a single management team lower per-unit costs.
  • Premium rents with higher risk: beach and coastal homes, where the insurance and mitigation line items decide whether the numbers hold.

If you are a first-time out-of-state investor, begin with one single-family home in a suburban area, learn how the market and the management work, then scale. If you are an experienced DFW owner with several doors, build-to-rent or multifamily can give you a more efficient structure. Our multifamily and build-to-rent services are designed for that second group.

Why local housing needs matter for this choice is something we cover in our piece on local housing needs and better investments. The short version: buy what the neighborhood’s renters actually need, not what looks good on a spreadsheet.

Costs and risks Texas investors should price in

This is the section that separates a good Jacksonville purchase from a regretted one. A Texas portfolio has its own burdens, mainly property taxes. Florida replaces some of them with others.

Insurance and wind mitigation

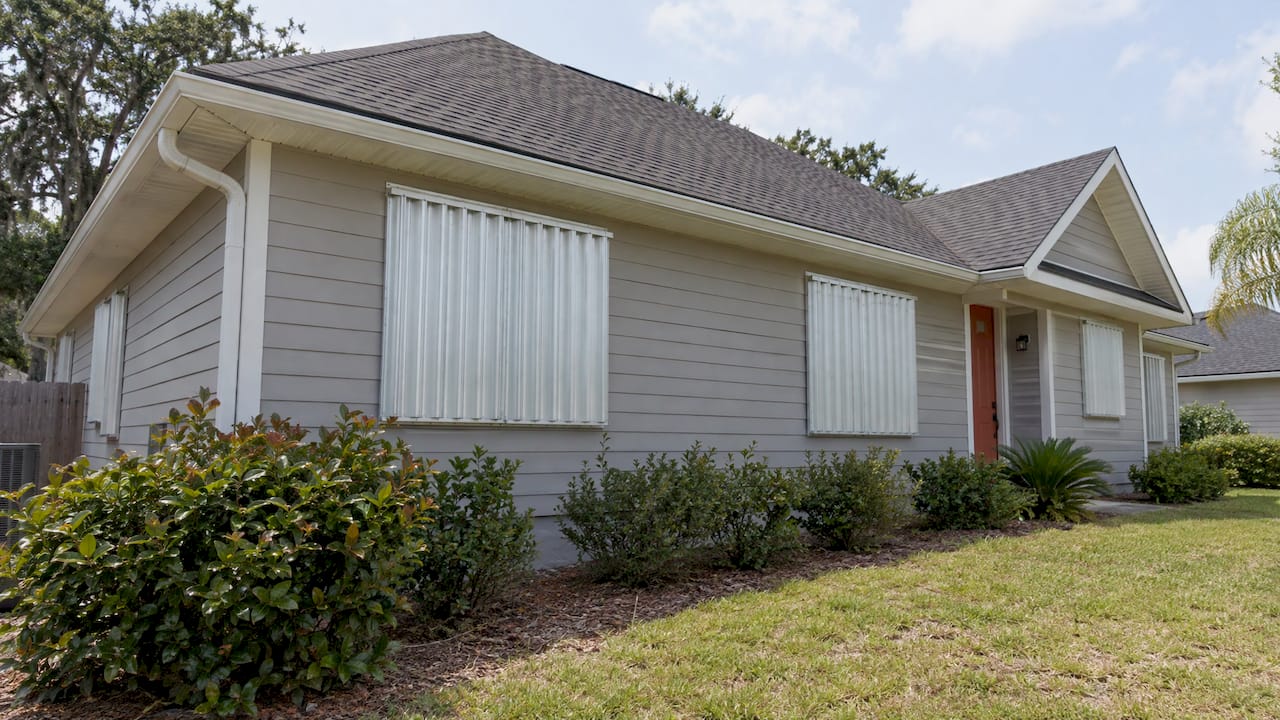
Hurricane exposure shapes insurance cost. Florida’s Office of Insurance Regulation explains that insurers must provide information on available hurricane-mitigation discounts, and that an authorized inspector completes the Uniform Mitigation Verification Inspection Form (OIR-B1-1802), effective April 1, 2026. In practice, ask for that inspection on any home you are evaluating, and ask your insurance agent how roof age, roof shape, shutters and opening protection change the quote. Roof condition is the biggest variable in many cases, so it helps to understand how to fortify a Florida roof before you budget for repairs and upgrades.
Florida rental roof and fitted storm shutters

Flood zone and elevation

Check the flood zone designation and the property’s elevation for every address, including ones that look inland. Flood insurance is priced separately from homeowners coverage, and lenders may require it depending on the zone. Get a quote before you go under contract.

Taxes, reserves and vacancy

Florida investment properties are assessed differently from homesteaded homes, and the assessed value can change after a sale. Confirm the current rules with the Duval County Property Appraiser (or the appraiser in the county you are buying in) and model the tax bill at your purchase price, not the seller’s. Keep a reserve for vacancy and capital items. Occupancy near 91% in multifamily is healthy but not a guarantee for any one unit.

Remote ownership risk

The quiet risk for a Texas-based owner is distance. A leak found three weeks late, a contractor you cannot verify, a lease you cannot enforce: these cost more than any rate difference. Plan for local eyes on the property.

How to compare a property’s income and expenses

Use the same discipline you use in DFW, with Florida line items added.

  1. Pull rent comparables for the exact neighborhood and bedroom count, not the metro average. The $1,470 multifamily average and the $1,614 Jacksonville Beach figure show how widely rents differ by area.
  2. Build the expense side honestly: property taxes at your purchase price, a real insurance quote with wind mitigation and flood, management fees, maintenance reserves and vacancy.
  3. Calculate net operating income and the cap rate, then compare with the numbers in our Jacksonville cap rate analysis.
  4. Inspect the big systems: roof, HVAC, plumbing and drainage. Order the wind mitigation inspection before closing.
  5. Check the neighborhood’s demand: nearby employers, commute times, school zones and how long comparable rentals sit before leasing.
  6. Price the management and renovation plan before you close, so the first-year budget contains real figures.

Run the model three ways: base case, a case with rents 5% lower, and a case with insurance higher than quoted. If the deal only works in the best case, move on.

Our perspective on investing in Jacksonville

Out-of-state investors rarely lose money because they picked the wrong city. They lose it because they bought without local data, hired management that could not respond quickly, or skipped the insurance math.

At Auben, our approach combines local market expertise with investor-focused strategies. Our pod-based team structure gives each owner a focused group that knows the neighborhood, our in-house maintenance keeps repairs fast, and our vendor selection process is transparent. Proactive resident retention and technology-enabled reporting support steadier occupancy and clearer numbers for owners who live hundreds of miles away.

We have served 2,700 properties across 10 regional markets over more than 15 years, including both Fort Worth and Jacksonville. That is why we encourage DFW investors to treat Jacksonville as a managed, underwritten decision: pick the area for your goal, price the Florida risks first, and put local operators in place before closing.

MediaBeast

Work with Auben in Jacksonville

If you want a Jacksonville purchase handled end to end, we can help with acquisition through our brokerage services, renovation oversight, leasing and tenant placement, and day-to-day Jacksonville property management. Owners with larger portfolios can add asset management to keep the strategy on track.

Aubenrealty

If you are comparing markets, start with a conversation about your goals and budget. Visit Auben Realty to reach the team, or browse homes for rent in Jacksonville to see the kind of properties we lease.

FAQ

Is Jacksonville a good place for a Dallas-Fort Worth investor to buy?

It can be, if your goal is diversification and you have local management. The city has grown nearly 10% from 2020 to 2024, and multifamily occupancy sits near 91%. Hiring has cooled, so underwrite steady rents rather than rapid growth.

What are the best areas in Jacksonville to invest in?

It depends on your strategy. In-town neighborhoods like Riverside, Avondale and San Marco suit value-add buyers, Southside and Mandarin suit family rentals, and the Westside, Northside and Clay County suit lower entry prices and newer builds. Beach communities offer premium rents with higher insurance exposure.

What extra costs should I expect compared with Texas?

Insurance is the main one, especially for homes near the coast or with older roofs. Florida’s insurance regulator describes a wind mitigation inspection form that can support discounts. Also check flood zones and model property taxes at your purchase price.

Can I own a Jacksonville rental from Texas?

Yes. Many investors do, using a local brokerage for acquisition, a property manager for leasing and maintenance, and clear monthly reporting. The key is having someone local who can inspect, respond and verify work.

How much does a Jacksonville rental cost to manage?

Management pricing depends on the property type and scope. Contact our team through the Jacksonville property management page for a quote based on your property.

Sources

Best Cash Flow Markets 2026: Where Rentals Still Pay

The strongest rental cash flow in 2026 sits in older Midwest and Mid-Atlantic metros: Cleveland, Detroit, Baltimore and St. Louis. Gross yields there are the highest in the country, but they come with lower-priced homes, heavier upkeep and slower appreciation. Southern and Sun Belt metros such as Houston, Dallas-Fort Worth, Kansas City and Jacksonville offer thinner headline yields, deeper renter demand and more stable economies. The right market depends on how much management risk you can carry and whether you hold the asset yourself or hand it to a manager.

Aubenrealty
Make Rental Cash Flow More Manageable
Auben Realty provides property management, renovation, and tenant placement services for investors seeking less hands-on ownership.

Explore Auben Realty

TL;DR

  • Cleveland and Detroit lead the 2026 rankings on gross rental yield (15.4% and 18.4% as of October 2026), but gross yield ignores taxes, insurance, vacancy, maintenance and management.
  • Positive cash flow clusters in cheaper, older housing stock. It often sits in weaker neighborhoods, so the yield comes with operating risk.
  • With home values roughly flat, lenders and analysts are pushing investors to underwrite to rent rather than appreciation.
  • Rental vacancy rose to 7.6% nationally in Q3 2026, and it is highest in the South, so check local vacancy before trusting a market’s reported rent.
  • Run every deal through net numbers: rent roll, tax bills, insurance, reserves and a conservative exit assumption.

Table of Contents

What “cash flow market” means in 2026

A cash flow market is a metro where typical rent covers the mortgage, taxes, insurance, repairs, vacancy and management, and still leaves money in your pocket. The simplest screen is gross yield: median monthly rent times 12, divided by median sold price. Resideline’s October 2026 rankings use exactly that formula and are explicit that it ignores taxes, insurance, vacancy, maintenance and management. It is a screening metric, not a cap rate or a return forecast.

That distinction matters because the markets with the biggest gross yields are the ones where costs eat the most of the rent. Treat the rankings below as a shortlist, not a buy signal.

The backdrop also changed. AHLend’s mid-year outlook argues that with essentially flat home values, the 2026 play is cash flow rather than appreciation, with investors underwriting to rent through DSCR loans. That is a lender’s view, but it matches what we see at the deal table: buyers who need a rising market to make the numbers work are struggling, and buyers who can pencil a deal on today’s rent are still closing.

The markets leading on cash flow

The high-yield Midwest and Mid-Atlantic

In ApriFind’s October 9, 2026 analysis, positive cash flow on single-family listings was most frequent in older Midwest and Mid-Atlantic cities such as Cleveland, Detroit, Baltimore and St. Louis. Cleveland and Detroit led on the share of listings that cash flow, at 27% and 25%.

The price and rent picture from Resideline’s October 3, 2026 data shows why:

Metro Median sold price Median 3-bed asking rent Gross yield
Detroit $88,000 $1,350 18.4%
Cleveland $121,000 $1,550 15.4%

For contrast, the same dataset puts median sold prices at $1,648,500 in San Francisco and $860,000 in New York City. Rents in those metros are higher, but not high enough to close that gap on a cash flow basis.

Other lists point the same direction. One lender’s 2026 roundup estimates gross yields of 7% to 9% in Buffalo and Indianapolis, and 9% to 12% in Cleveland, with Grand Rapids in the same 7% to 9% band. Treat those as estimates; the useful signal is that the same handful of Rust Belt and Great Lakes metros keep appearing.

The Sun Belt and Central markets

The cheapest markets are not the only ones that work. Houston, Dallas-Fort Worth and Jacksonville show up repeatedly in 2026 cash flow coverage, and Kansas City is a common pick for investors who want affordability alongside a diversified job base. These are markets where we manage property every day, so we know what the headline yields leave out.

Some examples of what a Sun Belt investor weighs against the rent:

None of these fees is a deal breaker. Each is a line item that belongs in your model before you compare one city’s yield to another’s.

Why gross yield overstates what you keep

A 15% gross yield does not mean a 15% return. Here is an illustrative example using Cleveland’s median figures from above. The expense ratio is our assumption for the example, not a published figure.

  1. Rent: $1,550 a month, or $18,600 a year.
  2. Purchase price: $121,000, giving a gross yield of about 15.4%.
  3. Assume operating costs (taxes, insurance, repairs, vacancy, management, turnover) take 50% of rent: $9,300 a year.
  4. Net operating income: $9,300, which is a cap rate of about 7.7% on the purchase price, before debt service and before any renovation budget.

Change the expense ratio and the answer moves fast. In a Denver rental guide, one analyst estimates that recurring operating expenses run 55% to 65% of gross potential income. If you apply 60% to the Cleveland example, net income falls to $7,440 and the cap rate to about 6.1%. Older housing stock tends to sit at the high end of that range because roofs, plumbing and electrical fail more often.

Turnover is the cost investors forget most. Between cleaning, paint, repairs and lost rent, a single vacancy can take a big bite out of a year’s net income. Our breakdown of where $1,000 to $5,000 goes at rental turnover walks through the line items. Even routine upkeep counts: a realistic rental home cleaning schedule between tenants and during occupancy belongs in your annual operating budget, not in a footnote.

Cleaner wiping kitchen cabinets between tenants

If you plan to finance, also separate the metrics. Cap rate measures the property’s income against its price. Cash-on-cash measures your cash return against the cash you put in. We explain how they diverge in our cap rate versus cash-on-cash guide.

Rent has been soft. One 2026 market roundup put the national median rent at $1,353 in January, down 1.4% from a year earlier, and that source describes it as the sixth straight monthly decline. Treat that as a directional indicator rather than a precise measure.

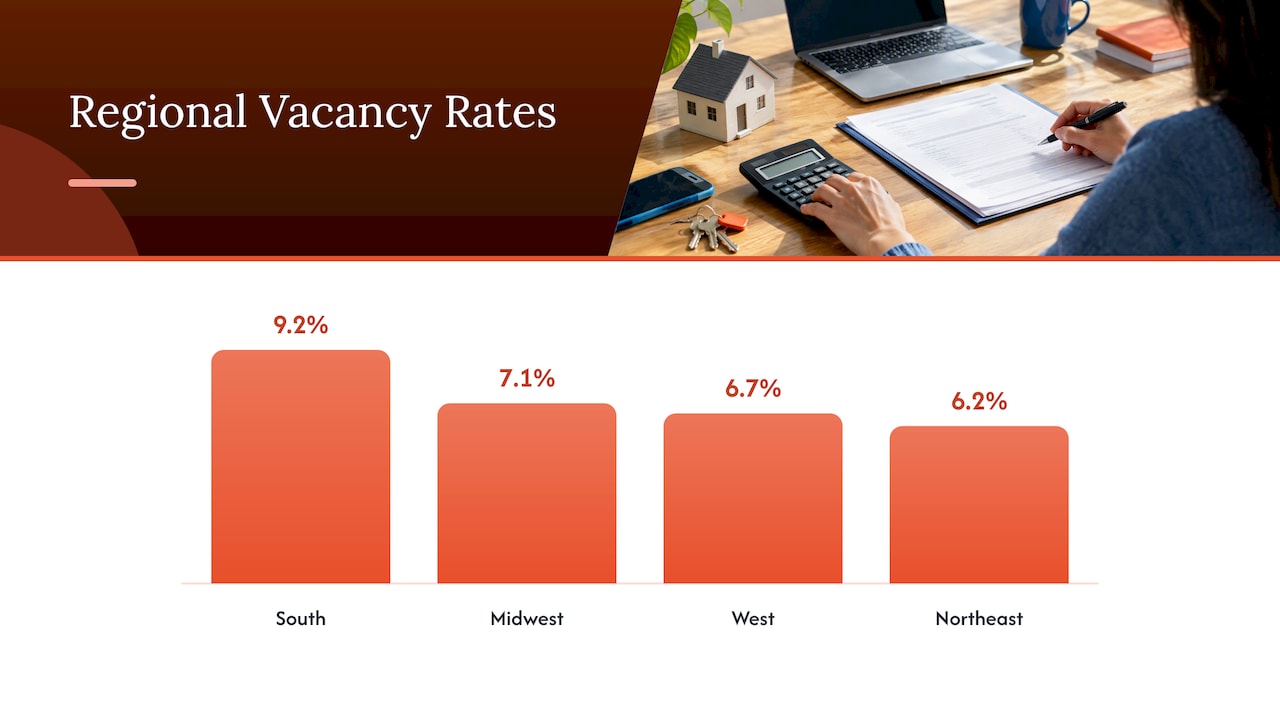
The Census Bureau’s figures are firmer. The national rental vacancy rate was 7.6% in Q3 2026, up from 7.1% a year earlier and 7.3% in Q2. The regional and location breakdown matters for market selection:

Area Q3 2026 rental vacancy
South 9.2%
Midwest 7.1%
West 6.7%
Northeast 6.2%
Principal cities 8.8%
Suburbs 6.5%
Outside metro areas 6.4%

Two takeaways. First, the Midwest’s high yields come with vacancy below the South’s, which helps the case for Cleveland and its neighbors. Second, suburbs have vacancy about two points lower than principal cities, so a suburban single-family or small multifamily rental in a Sun Belt metro can hold up better than a downtown unit. The same aggregator noted that luxury apartments sat at an 11.1% vacancy rate, a sign of oversupply at the top of the market, not of weak demand for ordinary rentals.

There is also a demand-side offset. Zillow figures cited by AHLend show the typical monthly mortgage payment with 20% down at $1,884, slightly below typical rent. That keeps many households renting because the down payment is the barrier, which supports the renter pool in affordable markets.

Vacancy and rent trends: the risk behind the yield

The trade-off: cash flow versus appreciation

The cheapest markets rarely appreciate fastest. A common rule of thumb among investors is that the best initial cash flow comes from markets with weak rent growth and appreciation outlooks, while higher-growth markets start with thinner yields. Cleveland is a good example: one 2026 market guide calls it the highest cash flow play in the Midwest, with slower long-term appreciation possible.

The same logic applies to property type. ApriFind’s analysis found that small multifamily buildings of two to four units cash flow more often than single-family homes, but cash flow tends to concentrate in weaker neighborhoods, which it rates with higher risk scores. Cash flow and risk are tied together.

If you want a middle path, pick a metro where the job base is broad, since employers drive renter demand. Kansas City, with finance, technology and manufacturing, is often cited that way. Confirm employment data against Bureau of Labor Statistics figures for the specific metro before you commit.

Our view of the single-family rental market is that the product holds up when the numbers are underwritten conservatively. We cover that in the single-family rental market and what’s to come and in our piece on whether single-family rental is a good idea. For investors who want scale and professional operations, build-to-rent communities are another route to the same rental demand.

How to check a market before you trust its numbers

A ranking gets you to a shortlist. A deal gets decided on the property’s own documents. Before you buy:

  1. Get the paperwork. Ask for the rent roll, tax bills, insurance records and leases, then verify that recurring income and expenses match what the seller claims. RealData’s underwriting guidance also suggests normalizing one-time items and modeling debt service and DSCR.
  2. Request the full model. For larger deals, ask for the T-12 (trailing twelve months of operating results) and the rent roll, and compare rent, vacancy, expenses, reserves, exit cap and loan assumptions to dated outside sources, as Relli’s pro forma checklist recommends.
  3. Stress the exit. Test an exit cap rate above your purchase cap rate, and test expenses growing at least as fast as rent. That same checklist cites NAA data showing 2025 expense growth of 4.6% against revenue growth of 2.7%.
  4. Walk the local costs. Property taxes, insurance, municipal fees and any special assessments differ by city and sometimes by street. Price them for the actual address, not the metro average.
  5. Budget reserves and turnover. Older stock needs a larger capital reserve. Put a number on it before you offer.
  6. Decide who operates it. The same property can cash flow with a good manager and lose money with a poor one. Include management fees in the model, even if you plan to self-manage at first.

Our perspective on 2026 cash flow markets

Investors ask us where the highest yield is. We answer with a different question: where can you hold the asset well for ten years?

After more than 15 years and 2,700 properties served across 10 regional markets, our view is that cash flow is made at the operating level. A market’s median yield is an average. Your result depends on which block you buy on, what the renovation costs, how fast units turn and how well residents are retained.

That is why we run a pod-based team structure, keep maintenance in-house and select vendors transparently. Controlling repair cost and downtime is often the difference between a modeled yield and a realized one. We pair local market knowledge in places like Houston, Dallas-Fort Worth, Kansas City, Charleston, Columbia and Jacksonville with an investor’s underwriting discipline.

In a year of flat values and softer rents, we would rather help an owner keep a good tenant for another twelve months than chase a higher headline rent. That is the approach we bring to every property we manage.

MediaBeast

Put the numbers to work with Auben

If you are narrowing down markets, we can help you test deals against local rent, vacancy and operating costs, then run the property after you close. Our property management covers leasing, tenant placement, maintenance and renovation oversight, and our brokerage services support acquisitions and sales for investors.

Aubenrealty

Already own a portfolio? Our asset management team works on the returns side, so your properties are managed to the numbers you underwrote. Start at aubenrealty.com and tell us which markets you are weighing.

FAQ

Which city has the best cash flow in 2026?

On gross yield, Detroit and Cleveland top the major metro rankings, at 18.4% and 15.4% as of October 2026, based on median asking rents and sold prices. Gross yield ignores operating costs, so the net result will be well below those figures. Run the property-level numbers before you rely on any ranking.

Is cash flow better than appreciation in 2026?

With home values roughly flat, many lenders and analysts say underwriting to current rent is the safer approach this year. Appreciation can still add to returns, but a deal that only works if prices rise is harder to defend. Cash flow markets typically offer less upside on price, so decide which return you need.

Are Sun Belt markets still worth it for cash flow?

They can be, with careful underwriting. The South had the highest Q3 2026 rental vacancy at 9.2%, so you need to check local supply, concessions and suburban versus urban location. Markets like Houston, Dallas-Fort Worth and Jacksonville offer deep renter demand and diversified economies.

How much of my rent will go to expenses?

It depends on the age of the property, the city and how it is managed. One Denver analysis estimates recurring operating costs at 55% to 65% of gross potential income. Build your own model from actual tax bills, insurance quotes, repair history and management fees.

Sources

Columbia, SC Rental Market: Rents, Vacancy and Demand in 2026

The Columbia rental market is steady, affordable by Sun Belt standards and in the middle of a supply wave. Depending on the data source, a typical Columbia unit asks between roughly $1,330 and $1,520 a month. One-bedrooms mostly sit near $1,000 to $1,300 and three-bedrooms near $1,700 to $1,850. Rent growth is flat to modest, and occupancy is softer than it was a few years ago because thousands of new apartments are being built. This guide lays out the numbers, explains why they differ, and shows what they mean if you own or plan to buy rental property in the Midlands.

Aubenrealty
Manage Columbia Rentals With Less Hands-On Work
Auben Realty combines local market expertise with property management, renovation, and tenant placement services for owners and investors.

Visit Auben Realty

TL;DR

  • Median asking rent across Columbia ZIP codes is about $1,523 for all unit types, with one-bedrooms near $1,031 and three-bedrooms near $1,713 in one October 2026 dataset.
  • Multifamily asking rents averaged $1,332 in Q1 2026, up 1.3% year over year, so growth is slow and stable rather than hot.
  • About 1,897 units were under construction in Q1 2026, and multifamily occupancy was 89.5%. Owners who price and market well will keep the edge.
  • Downtown is the priciest submarket and the center of new development. North Richland County is the growth corridor to watch.
  • Renting saves only about $271 a month over owning in Columbia, one of the smallest gaps among large U.S. markets, which supports steady demand for single-family rentals.

Table of Contents

What rents look like by bedroom count

No single number describes Columbia rent, because every dataset samples different listings. Some count only large professionally managed apartment communities, some pull from online listings across all property types, and some cover only certain ZIP codes. Read them as a range.

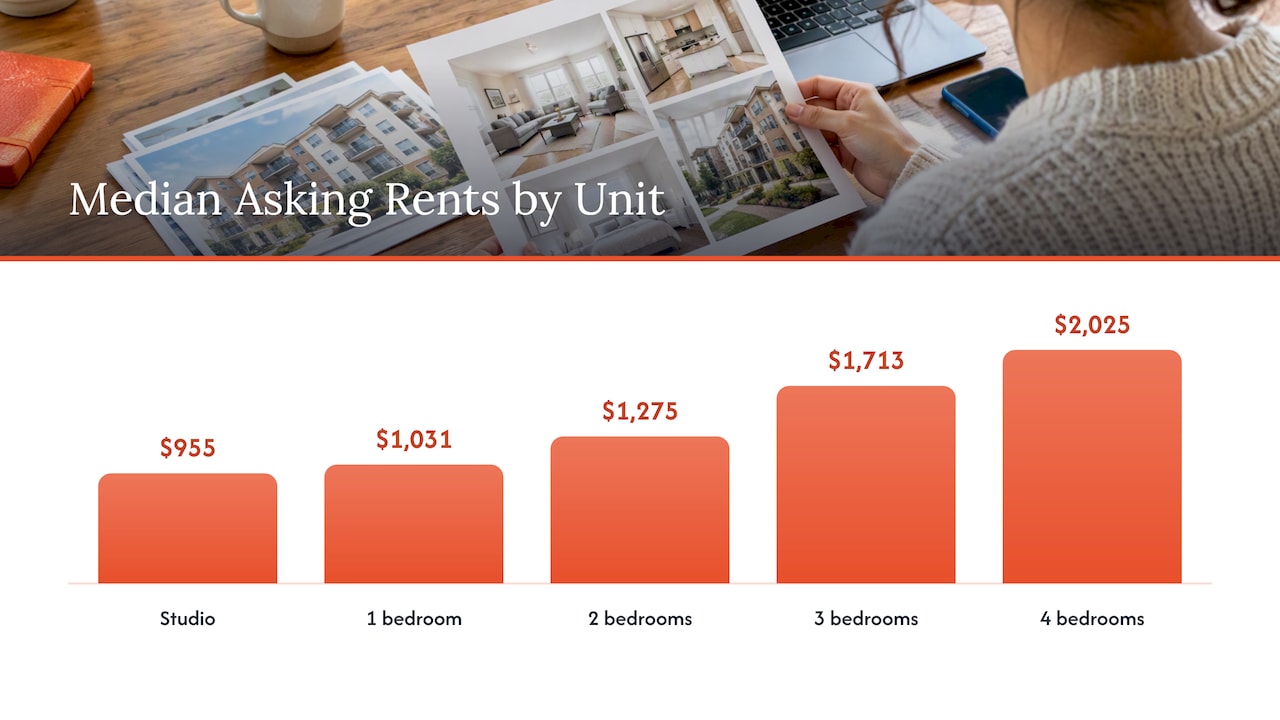
The most useful property-type breakdown comes from PropMetrics, updated October 2026, which reports median asking rents across Columbia ZIP codes:

Unit size Median asking rent
Studio $955
1 bedroom $1,031
2 bedrooms $1,275
3 bedrooms $1,713
4 bedrooms $2,025
All units $1,523

The jump from two to three bedrooms is the number to notice. A three-bedroom house costs about $440 more than a two-bedroom unit, which is where the single-family rental segment starts to separate from the apartment market. Families, military households connected to Fort Jackson and graduate students sharing space tend to shop in that bracket.

For a second reference point on the apartment side, RentEst’s September 2026 report puts average apartment and condo rent at $1,268 for one-bedroom units across 107 properties and $1,196 for two-bedrooms across 59 properties. Samples that small move with a few new buildings, which is why one-bedroom averages can look higher than medians from broader data.

What rents look like by bedroom count

Why you will see different numbers online

An average is pulled up by luxury new construction, while a median is not. A figure for a single neighborhood near the University of South Carolina can run well above a metro-wide one. And asking rent is what landlords list, not necessarily what tenants sign for after concessions.

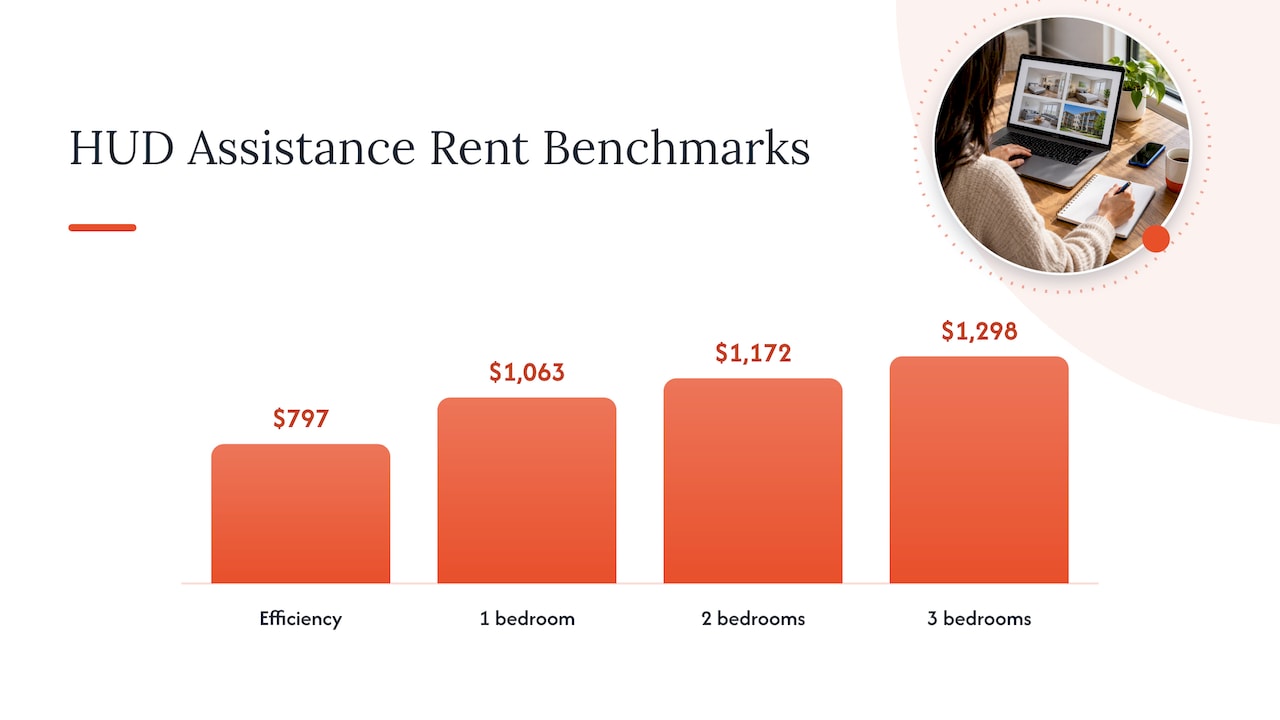
Government benchmarks add another layer. HUD’s HOME rent limits effective June 1, 2025 list Fair Market Rents for the Columbia metro area of $797 for an efficiency, $1,063 for one bedroom, $1,172 for two bedrooms and $1,298 for three bedrooms. These are program benchmarks. HUD explains that Fair Market Rents are estimates of 40th-percentile gross rents for standard-quality units, used for housing assistance. They matter if you plan to accept housing vouchers, but they are not a market average and should not be used to price a renovated listing.

HUD fair market rents by bedroom count

Where rents are heading

The short version: slowly up, not spiking. Colliers reported that average multifamily asking rents in Columbia were $1,332 in Q1 2026, a 1.3% increase year over year. Earlier, Colliers said in its Q4 2025 Columbia report that consistent supply growth was stabilizing rents and maintaining affordability.

IRR’s mid-year 2025 viewpoint adds useful context. Columbia’s long-term rent growth has lagged larger peer metros, but recent growth has been stable and has avoided the negative trends seen in supply-heavy Sun Belt markets. For an owner, that profile means fewer windfalls and also fewer sharp drops. Returns here come from steady occupancy and controlled expenses more than from rent spikes.

Supply, demand and what is driving both

Demand: government, the university and a growing region

Columbia’s economy rests on stable anchors. IRR’s 2026 annual viewpoint names state government and the University of South Carolina as the stable drivers, and notes that population has grown about 5% since 2020, trailing Charleston and Charlotte. That is growth without the boom-and-bust pattern. Students, state employees and military-linked households keep a floor under demand year after year.

North of the city, the picture is more dynamic. Colliers counts 648 units under construction in the North Richland County submarket as of Q1 2026, supported by demand from the emerging Scout Motors hub.

Supply: downtown is the epicenter

The same Colliers report shows 1,114 units under construction downtown in Q1 2026, which it says will expand downtown inventory by roughly 25%. Across the metro, the Colliers Q1 2026 market report shows total multifamily inventory of 54,343 units after 777 new deliveries in the quarter.

If you are evaluating a new-build deal or an apartment purchase in this pipeline, run the numbers with realistic lease-up assumptions. Tools such as multifamily deal analysis tools can help you stress-test rents and occupancy before you commit.

Neighborhoods: where rents run highest and lowest

IRR’s 2026 annual report identifies Downtown as the most expensive submarket in Columbia. That fits what you see on the ground: new mid-rise and mixed-use buildings near Main Street and the Vista price above the metro average, and they compete mainly with each other.

Outside the core, rents step down. Single-family neighborhoods across the Northeast, Irmo, Lexington County and the areas near Fort Jackson draw families who want a yard, a garage and school access. Those households rent three- and four-bedroom homes in the $1,700 to $2,000 band, and they tend to stay longer than apartment tenants. Properties close to the university behave differently again. They lease on an academic calendar, often with pre-leasing months ahead, and they need active turnover management each summer.

Because published data on individual ZIP codes varies widely in quality, treat any ZIP-level number as a starting point and confirm it against recent signed leases for comparable homes on the same street.

Occupancy and vacancy: the investor signals

Occupancy is where the supply wave shows up. Colliers reports Columbia’s multifamily occupancy at 89.5% in Q1 2026, down from 90.3% the prior quarter, with net absorption of 204 units. Innago’s 2026 vacancy report puts the metro rental vacancy rate at 9.1% as of Q1 2026, and links South Carolina’s vacancy trends partly to heavy construction in metros like Columbia.

What this means in practice:

  • Newer apartment communities will compete on concessions. A single-family home with a good renovation, a fenced yard and a fast response to maintenance requests competes on a different axis.
  • Days on market matter more than the last dollar of rent. A vacant month costs more than a $25 rent bump earns back over a year.
  • Retention is the cheapest source of income. Tenants who renew save you the turnover cost, cleaning, leasing fees and vacancy.

Renting versus owning in Columbia

Columbia is one of the markets where renting offers the least savings. A January 2026 LendingTree study, reported by the Post and Courier, found renters saved about $271 a month compared with homeowners, the third-smallest gap among the 100 largest U.S. markets. The assumptions behind that comparison include down payment, mortgage rate, insurance, taxes and maintenance, so your own household’s math may differ.

For landlords, a narrow gap has two effects. Some renters will decide to buy, so the tenant pool turns over. And well-located houses that rent for close to a mortgage payment give owners a clearer picture of cash flow, which is why single-family rentals remain a core strategy here.

Short-term rentals compared with long-term leases

Short-term rental income in Columbia is real but modest. AirDNA reported 96 active listings in September 2026, with average annual revenue of $29K, 60% average occupancy and an average daily rate of $144. A property earning $29K gross still has to cover cleaning, platform fees, utilities, furnishing and more active management. Compare that with a standard 12-month lease at the rents above, which brings predictable income with less operating work. Check city and HOA rules before listing any home short-term.

What this means if you own or plan to buy

  1. Price against your direct comparables. Use the bedroom-level medians as a frame, then adjust for condition, parking, pets and distance to downtown, the university or Fort Jackson.
  2. Underwrite conservatively on occupancy. With multifamily occupancy under 90%, assume some vacancy and concessions in the first year of any new purchase.
  3. Favor the segments with fewer new competitors. Renovated single-family and small multifamily properties are not the ones flooding the downtown pipeline.
  4. Plan maintenance before it is urgent. Turnover is where margins are won or lost. Reliable vendors and a preventive schedule protect rent.
  5. Watch the north. The Scout Motors corridor in North Richland County is where new demand is being planned for.

Our earlier posts on studying rental rates before investing and getting good deals on investment properties go deeper on the purchase side.

Our perspective on the Columbia market

We have managed 2,700 properties across 10 regional markets over more than 15 years, and Columbia behaves like the markets that reward patient owners. Rent growth is slow, demand is anchored by government, the university and the military, and new supply is arriving. That combination punishes owners who guess and rewards owners who manage.

Our approach is to treat a rental as an investment asset, not a chore. A pod-based team gives each owner a focused group of people who know their home. In-house maintenance and transparent vendor selection keep repair costs and response times under control. Proactive resident retention matters most in a market with rising supply, because a renewed lease avoids the vacancy and leasing cost that supply pressure makes more expensive.

If you own in Columbia, the question is rarely whether the market is good enough. It is whether your property is priced, presented and maintained so that it stays full. That is the work we do, so owners can earn reliable returns with minimal hands-on involvement.

MediaBeast

Get help turning market data into returns

Reading the numbers is the easy part. Pricing a specific house, placing the right tenant and keeping maintenance on schedule is where owners lose time. Our property management team handles leasing, tenant placement, rent collection, maintenance and renovation oversight for single-family, multifamily and build-to-rent properties. If you are still deciding what to buy, our brokerage services and asset management teams can help you evaluate acquisitions against the market conditions above. Pricing is not published, so contact us for a quote based on your property.

Aubenrealty

If you are looking for a place to rent rather than an investment, browse our current Columbia homes for rent.

FAQ

What is the average rent in Columbia, SC?

It depends on the dataset. PropMetrics shows a median asking rent of $1,523 across all unit types, while Colliers reports average multifamily asking rent of $1,332 for Q1 2026. Apartments skew lower and houses higher, so check the bedroom count and property type before comparing.

Are Columbia rents going up?

Slowly. Colliers measured a 1.3% year-over-year increase in average multifamily asking rent in Q1 2026. With nearly 1,900 units under construction, large jumps are unlikely in the near term, though well-run single-family rentals can hold their pricing.

Is Columbia a good market for rental investors?

It suits investors who value stability over speculation. Demand is supported by state government, the University of South Carolina and nearby growth around North Richland County, while renting is only slightly cheaper than owning. Occupancy is softer in new apartment buildings, so underwrite conservatively and plan for strong management.

Which part of Columbia is most expensive to rent in?

IRR identifies Downtown as the most expensive submarket. It is also where the largest share of new apartment construction is concentrated, so competition among new buildings is likely to increase.

Do HUD Fair Market Rents tell me what to charge?

No. HUD sets them as benchmarks for housing assistance programs, based on 40th-percentile rents for standard-quality units. Use them if you accept vouchers, and use current local listings to set your market rent.

Sources

Charleston Cap Rates in 2026: What Investors Should Expect

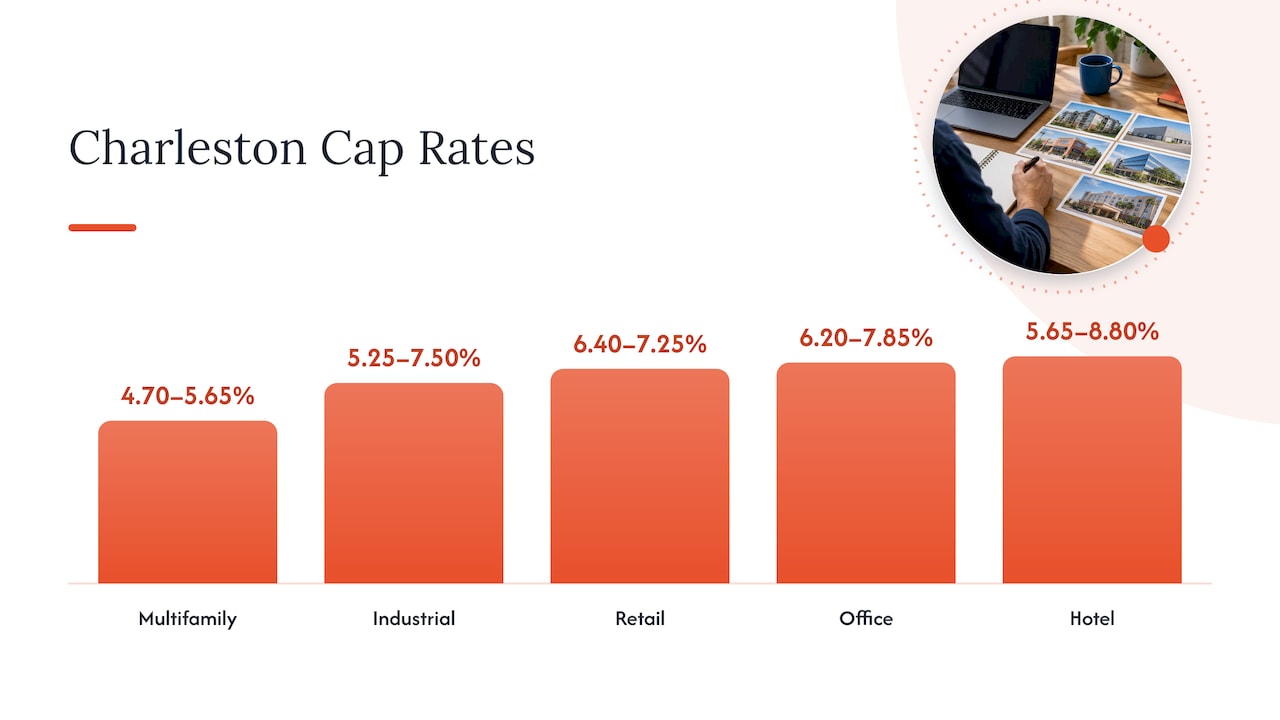
Charleston cap rates in late 2026 sit at roughly 4.70% to 5.65% for multifamily, with industrial, retail, office and hotel properties spread across a wider band of about 5.25% to 8.80%. The exact number you should expect depends on property class, location and condition, so treat any single citywide figure as a starting point for your own underwriting, not a verdict on a deal.

This guide gives you the published ranges, the formula, a worked example, and the local factors that push Charleston cap rates up or down. It is written for investors and owners deciding whether a Lowcountry property is priced fairly.

Aubenrealty
Put Charleston Property Numbers to Work
Auben Realty combines local market expertise with investor-focused strategies and property management for owners and investors.

Explore Auben Realty

TL;DR

  • A cap rate is net operating income divided by property value. It is a quick pricing yardstick, not a forecast of your return.
  • As of October 30, 2026, a published lender survey puts Charleston multifamily at 4.70% (Class A, metro) to 5.65% (Class C, suburban).
  • Other asset types run wider: industrial 5.25% to 7.50%, retail 6.40% to 7.25%, office 6.20% to 7.85%, hotels 5.65% to 8.80%.
  • Cap rates ignore financing, so pair them with cash-on-cash return, reserves and a realistic expense budget.
  • A low cap rate is not automatically a bad buy, and a high one is not automatically a bargain. Check the NOI behind the number.

Table of Contents

What a cap rate tells you (and what it doesn’t)

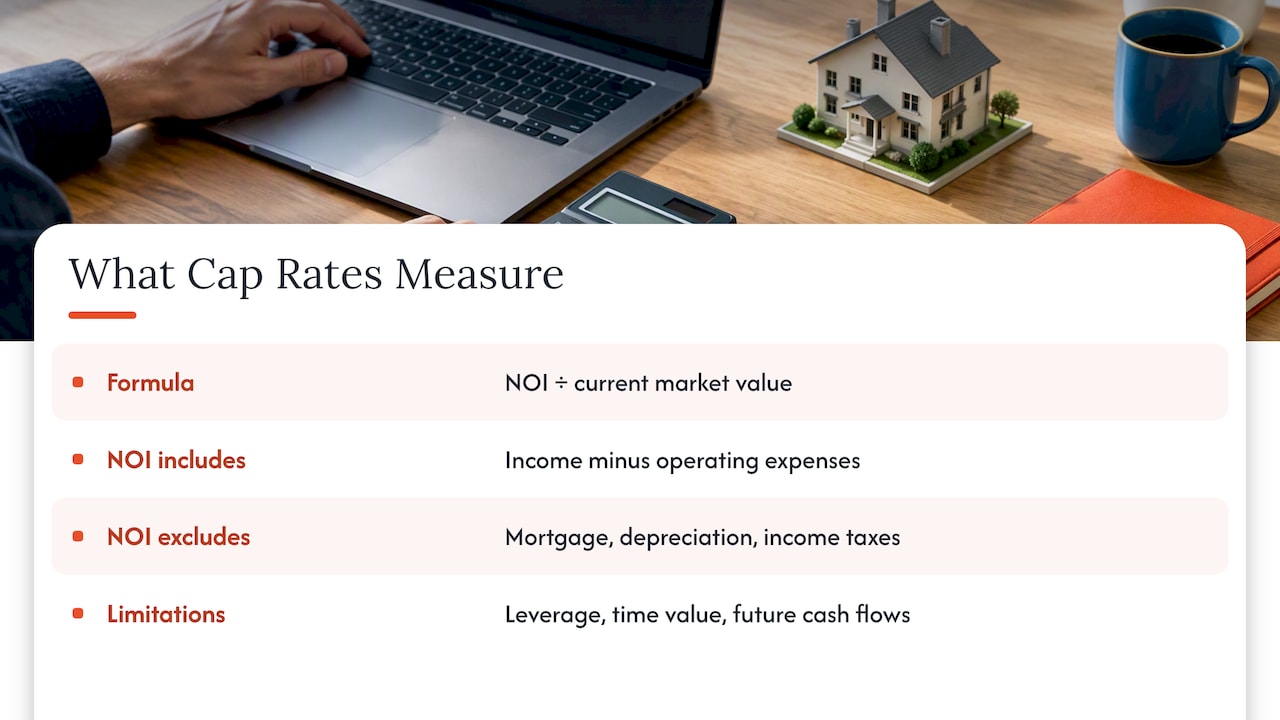
The capitalization rate estimates the annual return of an income property if you bought it with cash. You divide net operating income (NOI) by the property’s current market value. Investopedia’s definition also notes the limits: the measure does not account for leverage, the time value of money, or future cash flows from improvements, so it should not be used alone.

NOI is rent and other income, minus operating expenses: property taxes, insurance, management, maintenance, utilities you pay, and a vacancy allowance. It leaves out mortgage payments, depreciation and income taxes. That is why two investors with different loans can look at the same property and see the same cap rate but very different cash flow.

Cap rates also look forward. JPMorganChase describes them as measures that reflect investor return expectations, competition, monetary policy and local economic conditions, not a guarantee of realized returns. When you see 5% on a listing, you are seeing what the market is willing to pay for a projected income stream, and the projection is the part you have to test.

What a cap rate tells you (and what it doesn't)

The formula with a Charleston-style example

Here is an illustration with made-up numbers, not a listing:

  1. A small multifamily building is offered at $1,000,000.
  2. Gross scheduled rent is $100,000 a year. You allow 6% for vacancy and credit loss, leaving $94,000.
  3. Operating expenses (taxes, insurance, management, repairs, reserves, utilities) total $38,000.
  4. NOI is $56,000.
  5. Cap rate: $56,000 ÷ $1,000,000 = 5.6%.

Now change one input. If insurance and repairs come in $8,000 higher than the seller’s pro forma, NOI falls to $48,000 and the true cap rate at the same price is 4.8%. At a 5.6% target, the price that matches your numbers is about $857,000. That one exercise is why underwriting expenses matters more than debating the headline rate.

Current Charleston cap rates by property type

The most recent published breakdown we found for the market comes from a Charleston cap rate table from a commercial lender, dated October 30, 2026. It lists these ranges:

Property type Published Charleston range
Multifamily 4.70% (Class A) to 5.65% (Class C)
Industrial 5.25% to 7.50%
Retail 6.40% to 7.25%
Office 6.20% to 7.85%
Hotel 5.65% to 8.80%

Within multifamily, the same source shows Class A at 4.70% in the metro and 4.75% in the suburbs, and Class C at 5.64% and 5.65%. The spread between A and C is under one percentage point, which tells you the market prices newer product only modestly richer than older stock.

Treat these as ranges from one survey. Cap-rate tables from different publishers, and even the same publisher at different dates, disagree by a few tenths of a point, because they sample different trades, define classes differently and update on different schedules. Before you rely on a number, confirm it against recent closed sales for similar buildings and against a local broker’s opinion of value. If a figure you read last quarter differs from the one above, that is normal movement, not an error on your part.

Current Charleston cap rates by property type

Multifamily and single-family rentals

Multifamily is where Charleston’s published numbers are most consistent: Class A near the high 4s, Class C in the mid 5s. Single-family rentals and small build-to-rent communities are valued less uniformly. Small investors often price a rental house by comparing it to nearby sales and by its own rent and expenses, and the resulting cap rate is whatever those inputs produce. In a market with high home values, a single-family house can show a lower cap rate than an apartment building while still appealing because of appreciation potential and tenant demand. That trade-off is a strategy decision, and cap rate alone will not settle it.

If you are weighing houses against small apartments, our write-up on turning houses for rent in Charleston into investment opportunities walks through how owners think about that choice.

Industrial, retail, office and hotel

The commercial ranges are wider because the risk differs more from one property to the next. A long-term lease to a strong tenant on a modern industrial building sits at the low end. A short-lease flex building with an uncertain tenant sits at the high end. Hotels show the widest range, 5.65% to 8.80%, because income swings with occupancy and seasonality, which matters in a tourism-driven city.

Local supply conditions explain some of the spread. A Q1 2026 market report from a flexible-space marketplace described Charleston office as stable with 7.5% vacancy, while retail was supply-constrained with projected 2026 vacancy of 3.3%. It tied the office stability to a lack of new speculative development, which pushes demand toward existing space. Tight retail supply supports rents, but the published retail cap rates still sit above multifamily, a reminder that cap rates price lease risk and tenant quality, not only vacancy.

How Charleston cap rates have moved

Charleston multifamily cap rates compressed during the low-rate years, then repriced as borrowing costs rose. A Coldwell Banker Commercial multifamily report for the Southeast region, which appeared in search results for this topic, describes A and B class cap rates holding near 5.4% and sitting well below borrowing costs, with C class rates rising as prices readjust. That regional picture matches the pattern in the table above: the gap between what a stabilized property yields and what debt costs has been thin, and buyers have leaned on rent growth and expense control to make deals work.

We would be cautious about quoting any single “Charleston history” chart. Publicly available local series are sparse, and much of the historic data sits behind paid subscriptions. A practical approach is to build your own comparison set: pull the cap rates implied by the last 6 to 12 months of closed sales in the submarket you care about, and note the trend in asking prices versus sale prices. Your broker, lender and property manager can all supply actual operating statements to back up those numbers.

What drives cap rates in the Lowcountry

National forces set the baseline. Academic work on commercial real estate pricing, including a Real Estate Research Institute study by Liang Peng, finds that credit availability, prior risk-adjusted real estate performance, lagged house-price appreciation and nonresidential construction spending are important cap-rate drivers, and that higher cap rates go with greater pricing uncertainty. In plain terms: when credit is easy and recent performance is strong, buyers accept lower yields. When money tightens, yields rise and prices adjust.

Local factors then move a property above or below the baseline:

  • Location and flood exposure. Peninsula, West Ashley, Mount Pleasant, Summerville and North Charleston price differently. Flood zone status affects insurance cost, which comes straight out of NOI.
  • Insurance and taxes. Coastal wind and flood coverage can be a large expense line. Non-owner-occupied property taxes in South Carolina are assessed at a higher ratio than owner-occupied homes, so a cap rate built on the seller’s current tax bill can overstate NOI after a sale reassessment. Confirm the numbers with the county assessor before you finalize your pro forma.
  • Short-term rental rules. Charleston-area short-term rental regulation varies by jurisdiction and can change, so income that depends on nightly stays deserves a haircut until you have confirmed the local permit status.
  • Tenant demand. Port, aerospace, healthcare, tech and military employment support rental demand. Demand supports occupancy, but occupancy only matters if rents cover a realistic expense load.
  • Property condition. Deferred maintenance becomes an expense or a capital call. Roof age is a classic example: a commercial roof inspection before closing helps you decide whether the seller’s maintenance line is believable, and a roof near the end of its life is a price negotiation, not a footnote.

How to use a cap rate when you evaluate a deal

A cap rate is a screening tool. Slatt Capital’s guide to cap rates points out that a higher cap rate generally signals higher return and lower risk if you buy with cash, but that you should use it alongside other methods because projecting NOI is difficult in volatile markets. Here is a workable routine.

Step 1: Rebuild the seller’s NOI

Ignore the pro forma. Ask for 24 months of trailing operating statements, current rent roll, leases, tax bills and insurance quotes. Replace the seller’s management fee and maintenance figures with market ones. Many owner-operated properties show no management cost, which inflates NOI.

Step 2: Compare to the right set

Match class, age, size and submarket. A 1960s brick fourplex and a 2022 garden-style community do not share a cap rate even a mile apart.

Step 3: Layer on financing

If your loan costs more than the cap rate, leverage works against your cash flow until rents rise. Calculate cash-on-cash return and debt service coverage. Lenders typically want income comfortably above the loan payment, so run it before you fall in love with a property.

Step 4: Stress test

Model vacancy two points worse, insurance up 15%, and a roof or HVAC replacement in year three. If the deal still clears your minimum return, the cap rate is telling you something real.

Step 5: Think about the exit

Your sale price equals future NOI divided by the cap rate buyers will demand then. If you underwrite an exit at a lower cap rate than you paid, you are betting on market conditions, not on operations. A conservative plan assumes the exit cap rate equals or slightly exceeds the entry cap rate.

Common mistakes with cap rates

  • Comparing cap rates from different dates. A figure from 2021 says little about 2026 pricing.
  • Using asking rent instead of collected rent. Concessions, delinquencies and turnover reduce real income.
  • Leaving out reserves. A building with no replacement reserve line is not showing you its true NOI.
  • Treating the cap rate as total return. It excludes appreciation, principal paydown, tax benefits and capital improvements.
  • Chasing the highest rate. A 7% cap rate on a building with a failing roof and chronic vacancy can be worse than a 5% on a stable asset.

For a closer look at screening lower-priced deals, see our post on how to find cheap investment properties and judge their ROI.

Perspective: why the operator matters as much as the rate

We look at Charleston cap rates every week, and the lesson is the same: the number on the listing is a snapshot of someone’s assumptions. The number you earn is set by how well the property is run after closing.

Across more than 15 years and 2,700 properties served in 10 regional markets, we have seen two buildings with the same purchase cap rate end up with very different yields. The difference comes from leasing speed, resident retention, maintenance cost and vendor pricing. That is why we run a pod-based team structure, keep maintenance in-house and select vendors transparently. Each of those choices is designed to protect NOI, which is the numerator in every cap rate calculation.

For investors, we recommend underwriting with operating partners at the table. A property manager who knows Charleston submarkets can tell you what a unit will really rent for, how long it will sit, and what a turn costs. Pair that with an asset management plan that sets renovation scope against the rent it can support, and the cap rate you pay becomes a floor for your return, not a ceiling.

MediaBeast

Put the numbers to work with Auben

If you are buying, selling or holding Charleston-area rentals, we can help turn a cap rate estimate into an operating plan. Our team covers property management for single-family, multifamily and build-to-rent assets, leasing and tenant placement, renovation oversight, asset management and brokerage. We will help you test a seller’s NOI against local rents and expenses before you commit.

Aubenrealty

Start with our Charleston market page or talk to us about investor-focused brokerage services. If you already own, our asset management service looks at how to raise NOI through rents, expenses and renovations. Our fees are not published online, so contact us for a scope and quote.

FAQ

What is a good cap rate in Charleston, SC?

There is no single good number. Published ranges for late 2026 put Charleston multifamily at about 4.70% to 5.65%, while other asset types run higher. A good cap rate is one that, after your own expense and vacancy assumptions, clears your financing cost and your required return with a margin for error.

Are Charleston cap rates lower than in other South Carolina markets?

Generally, coastal and high-demand markets trade at lower cap rates than smaller inland markets, because buyers accept lower yields for stronger demand and appreciation. Compare the same property class and date when you check Charleston against Columbia or Greenville, since survey methods differ.

Can I use a cap rate for a single-family rental?

Yes. Divide the house’s annual rent, less vacancy and all operating expenses, by its purchase price or value. Remember that single-family rentals are usually priced against home sales, so the cap rate is an output of price, not what drives it. Use it with cash-on-cash return and your plans for holding the property.

Does a higher cap rate mean a better investment?

Not by itself. A higher cap rate often signals higher risk, such as weaker location, older systems, shorter leases or uncertain income. It can be a good opportunity if you can fix those issues, and a trap if you cannot. Verify the NOI and the condition of the property first.

Sources

Jacksonville Cap Rates in 2026, Seen From Fort Worth

Jacksonville multifamily cap rates sit at roughly 5% to 6% in 2026, depending on class and source, while retail and industrial trade around 7%. Dallas-Fort Worth multifamily averaged about 5.2% in the second quarter of 2026. For a Fort Worth investor, that means Jacksonville pays a little more per dollar of income, but the gap is small enough that taxes, insurance, vacancy and management quality can erase it.

Aubenrealty
Look Beyond the Headline Cap Rate
Auben Realty combines local market expertise with investor-focused strategies to help owners assess property management and investment needs.

Explore Auben Realty

TL;DR

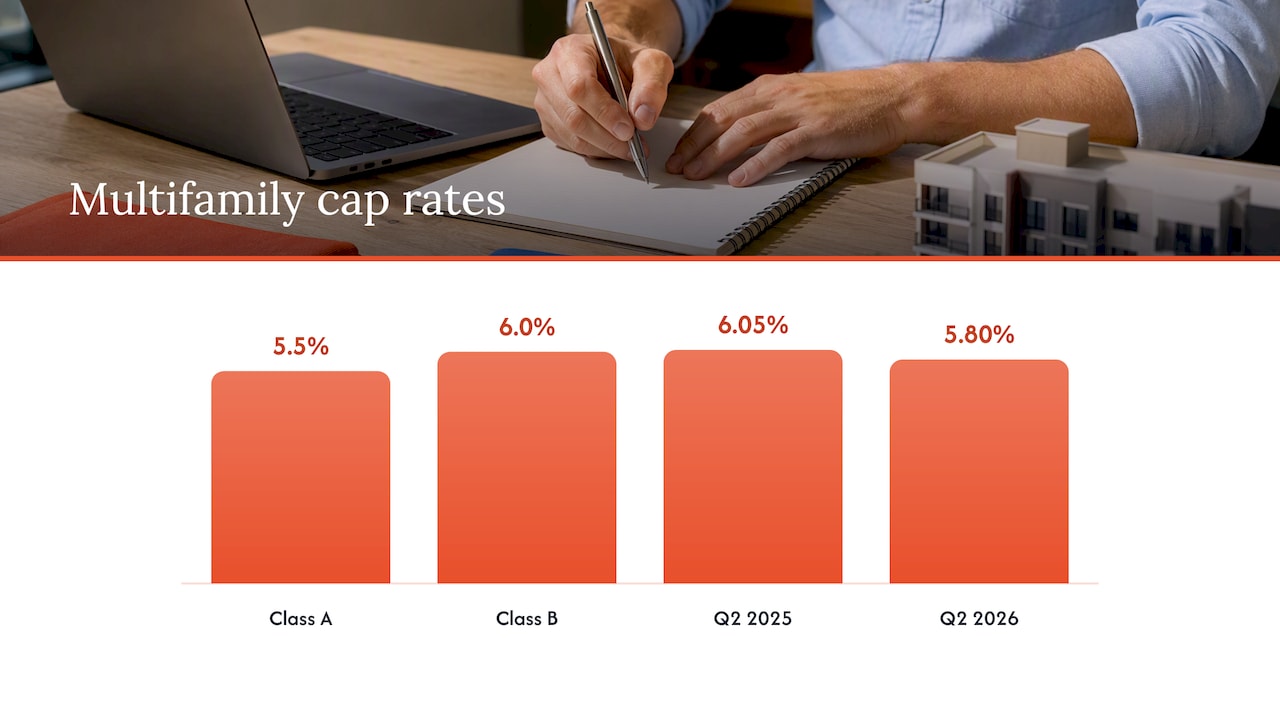
  • Jacksonville multifamily cap rates cluster between about 5.5% and 6.0% for Class A and B stock, with Q2 2026 compressing to 5.80%.
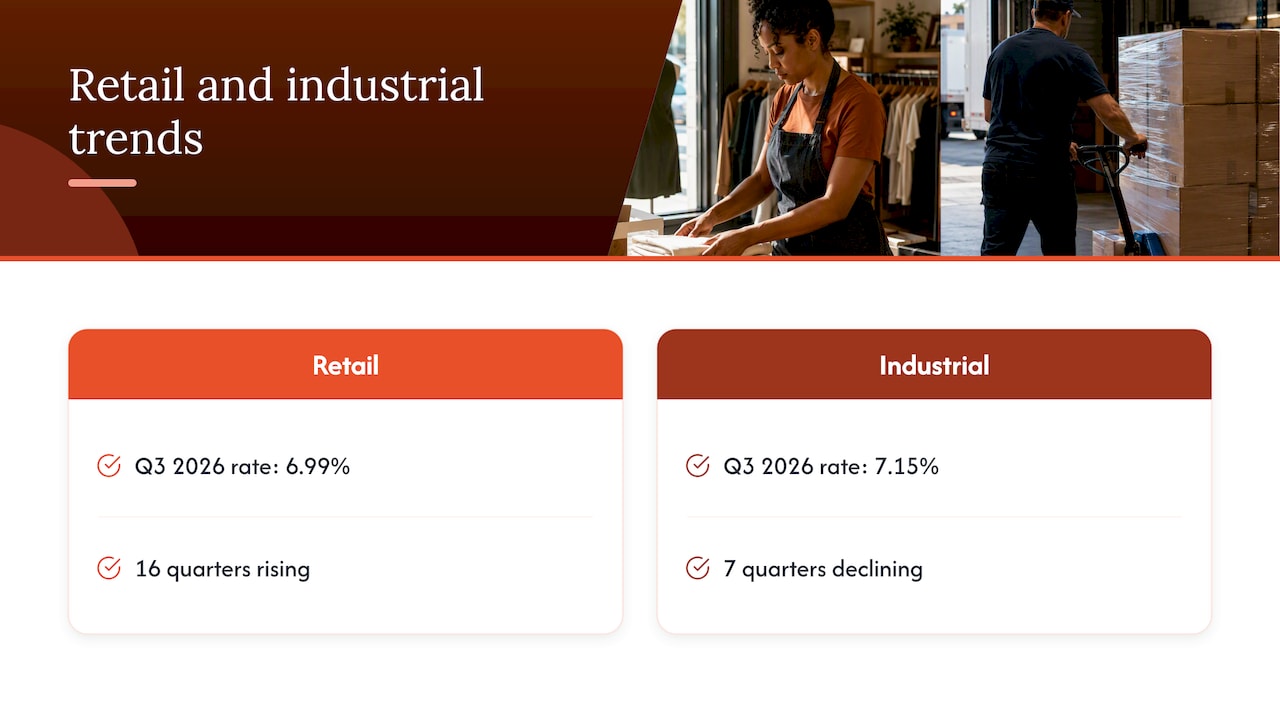
  • Jacksonville retail averaged 6.99% and industrial 7.15% in Q3 2026, and the two are moving in opposite directions.
  • Dallas-Fort Worth multifamily averaged about 5.2% in Q2 2026, so Jacksonville offers a modest premium, not a dramatic one.
  • A cap rate ignores financing and future cash flow. Compare it with cash-on-cash return and your own expense assumptions before you buy.
  • Cap rates only compare like with like: same property type, class, location and actual versus projected numbers.

Table of Contents

What a cap rate tells you (and what it leaves out)

A cap rate is a property’s annual net operating income (NOI) divided by its current market value, shown as a percentage. Investopedia’s definition frames it as a way to compare the relative value of similar properties. A building that produces $120,000 of NOI and is priced at $2,000,000 has a 6% cap rate.

NOI is rent and other income minus operating expenses such as taxes, insurance, maintenance and management. It leaves out mortgage payments, depreciation and income taxes. That is why a cap rate works as a snapshot of the asset, not of your personal return.

The same source notes the limits: cap rates do not account for leverage or future cash flows, and a discounted cash flow model can be better when income is irregular. Freddie Mac’s multifamily guidance adds a useful way to think about it: a cap rate combines a return on capital (like an interest rate) with a return of capital (like recovering your principal over time).

Two practical consequences follow:

  • A higher cap rate is not automatically better. It often signals more risk, a weaker location or a property that needs work.
  • A lower cap rate is not automatically worse. Buyers accept it when they expect rent growth or a safer tenant base.

Jacksonville cap rates by property type in 2026

Jacksonville is a mid-sized Florida market with a port, logistics base, military presence and a growing suburban ring toward St. Johns County. Cap rates differ a lot by asset type, so a single “Jacksonville cap rate” does not exist. Here is what the 2026 data shows.

Property type Reported Jacksonville cap rate Period Source
Multifamily, Class A 5.5% January 2026 Integra Realty Resources
Multifamily, Class B 6.0% January 2026 Integra Realty Resources
Multifamily, overall 5.80% Q2 2026 Southern Edge Capital
Multifamily, metro range 5.0% to 6.0% 2026 MaxLife Commercial
Retail (average) 6.99% Q3 2026 Matthews
NNN retail 5.75% to 7.5% 2026 MaxLife Commercial
Industrial (average) 7.15% Q3 2026 Matthews
Industrial, metro range 5.5% to 6.75% 2026 MaxLife Commercial
Office 7.5% to 9.5% 2026 MaxLife Commercial

The spread between sources is itself information. An average of closed sales (like the Matthews averages) and a metro-wide range of quoted figures answer different questions. When two reports disagree by a full point on the same asset type, check their definitions before you pick a number.

Multifamily: modest spread, cautious recovery

Integra Realty Resources reported a 50 basis point spread between Class A at 5.5% and Class B at 6.0% in Jacksonville multifamily. It describes the market as in a cautious recovery, with longer transaction times but optimism for Class A assets because of their appreciation potential.

The direction matters as much as the level. Southern Edge Capital reports Jacksonville multifamily cap rates compressing to 5.80% in Q2 2026 from 6.05% in Q2 2025. Compression means prices are rising relative to income, so buyers who waited for higher rates have mostly been disappointed.

Multifamily: modest spread, cautious recovery

Matthews reports an average Jacksonville retail cap rate of 6.99% in Q3 2026, after rising for 16 consecutive quarters. Industrial averaged 7.15%, after seven consecutive quarters of decline. Retail yields are drifting up while industrial yields are coming down, so the same “commercial” label hides two different stories.

Retail and industrial cap-rate trends diverge

Where the rate moves inside Jacksonville

MaxLife Commercial’s market guide says the widest spreads are in Class A office and mid-tier retail, and that compression is more pronounced toward St. Johns County, the Southside and suburban corridors. It also reports that Jacksonville commercial assets typically trade 25 to 50 basis points wider than comparable assets in Orlando and Tampa. Treat these as published market observations, not guarantees for any one building.

For neighborhood-level context on rents and demand, our Jacksonville market overview and the Jacksonville rental market breakdown show what drives the income side of the formula.

How Jacksonville compares with Fort Worth and Dallas-Fort Worth

Apartment Loan Store reports that Dallas-Fort Worth commercial cap rates compressed slightly in Q2 2026, averaging 5.2% for multifamily and industrial, 6.7% for retail and 7.9% for office. Against Jacksonville:

Property type Dallas-Fort Worth, Q2 2026 Jacksonville, 2026
Multifamily 5.2% average 5.0% to 6.0% range, 5.80% in Q2
Industrial 5.2% average 5.5% to 6.75% range, 7.15% Q3 average
Retail 6.7% average 5.75% to 7.5% NNN range, 6.99% Q3 average
Office 7.9% average 7.5% to 9.5% range

The sources use different methods and quarters, so the table is a rough guide and not an exact comparison. Still, the pattern is consistent: Jacksonville multifamily and industrial generally price at somewhat higher cap rates than Dallas-Fort Worth, while retail and office are close.

Why a higher cap rate in Jacksonville is not free money

A premium of 30 to 80 basis points on a $2 million building is roughly $6,000 to $16,000 a year of NOI at the same price. That sounds large until you check what sits between rent and NOI:

  • Property taxes. Texas has no state income tax but leans heavily on property tax. Florida’s burden differs by county. Compare the actual tax bill for each asset, not the state reputation. Our Duval property tax guide shows how to estimate it.
  • Insurance. Coastal and wind exposure in Northeast Florida can change the expense line materially. Get a real quote before you underwrite.
  • Distance. Owning in Jacksonville from Fort Worth means relying on someone else for leasing, maintenance and vendor oversight. That cost belongs in NOI.
  • Liquidity. Depth of buyers affects how fast you can exit. IRR notes longer transaction times in Jacksonville multifamily.

If the spread vanishes after those adjustments, the cap rate was only advertising a difference that does not exist.

What to check before trusting any cap rate

JPMorganChase’s cap rate explainer recommends comparing like-kind properties by type, location, income, expenses, quality, condition and durability, and checking whether income and expenses are actual or projected. In practice, ask these questions of every listing:

  1. Is the NOI actual or pro forma? A trailing 12-month statement beats a broker’s projection.
  2. Are expenses complete? Look for a management fee, reserves, payroll and realistic repairs. Owner-managed buildings often show none of these.
  3. Is the rent in place or market? Below-market leases can raise the future yield, and above-market ones can lower it.
  4. What class and condition is the building? A Class C asset at 6% and a Class A at 5.5% are not the same risk.
  5. Where is it? The same JPMorganChase piece lists proximity to employment centers, highways and transit as local drivers, along with tenant quality, rent growth and lease terms.

CBRE adds a caution: during uncertain markets, investor sentiment and pricing expectations vary more, so the gap between low and high yield estimates widens, particularly in lower-class office. A single published number hides that range.

Which way are cap rates headed?

CBRE’s 2026 outlook expected cap rates for most property types to decrease by 5 to 15 basis points, with more compression for good-quality assets. In its H1 2026 survey it noted that neighborhood retail, hotel and industrial saw the most compression among property types across the eastern U.S. The same outlook says total returns will depend mostly on asset selection and management, not market-wide appreciation. That is the part you control.

Cap rate versus cash-on-cash: use both

The cap rate assumes you pay all cash. Most investors do not. Cash-on-cash return measures annual pre-tax cash flow against the cash you actually invested, so it reflects your loan, rate and down payment. A property with a 6% cap rate can produce a weak cash-on-cash return if debt costs more than the property yields.

For a clear walkthrough of when each metric is the right one, see this cap rate vs cash-on-cash comparison. We also lay out the same trade-off with local numbers in our Houston cap rate analysis, which is a useful Texas benchmark for how this works.

A simple routine for comparing a Fort Worth deal and a Jacksonville deal:

  1. Rebuild NOI for both using actual expenses, including a professional management fee.
  2. Calculate the cap rate for each on the same basis.
  3. Run cash-on-cash with your real financing terms.
  4. Stress the result: vacancy up two points, insurance up 20%, rents flat for a year.
  5. Pick the deal that still works under stress, not the one that wins on the headline number.

Perspective: why we look past the headline cap rate

We operate in 10 regional markets, including Fort Worth and Jacksonville, and the pattern we see is consistent: investors who compare cap rates across cities usually get the income side right and the operating side wrong.

A cap rate is only as honest as the NOI beneath it. Our approach is to pair local market expertise with investor-focused strategy, so the expense line reflects what it actually costs to run a building there: in-house maintenance, transparent vendor selection, and proactive resident retention that keeps vacancy down.

That is why we think a few dozen basis points of spread between two cities matter less than who is running the asset. A well-managed building at a 5.5% cap rate can outperform a poorly managed one at 6.5%, because turnover, deferred repairs and slow leasing quietly consume the difference.

If you are weighing an out-of-state purchase, decide who will manage it before you decide what it yields.

MediaBeast

Run the numbers with a local team

If you are comparing Fort Worth against Jacksonville, or any of our other markets, we can help you underwrite both sides with real operating costs. Our asset management team works on investor-focused strategy for single-family, multi-family and build-to-rent holdings, and our Dallas/Fort Worth brokerage covers acquisitions and sales locally.

Aubenrealty

If you already own in Northeast Florida and want fewer hands-on hours, see our Jacksonville property management page, or start from our Jacksonville market page. To talk through a specific property, get in touch with Auben Realty.

FAQ

What is a good cap rate in Jacksonville?

There is no single good number. For multifamily, 2026 reports put Class A near 5.5% and Class B near 6.0%, with overall averages around 5.8%. A good rate is one that compensates for the property’s class, location, condition and your financing, not simply the highest one on the page.

Are cap rates higher in Jacksonville than in Fort Worth?

For multifamily and industrial, published 2026 figures generally show Jacksonville a bit higher than Dallas-Fort Worth, whose multifamily average was about 5.2% in Q2 2026. Retail and office are closer. Sources use different methods, so compare the same property type and period.

Do Jacksonville cap rates include property taxes and insurance?

A correctly calculated cap rate uses NOI, which is after operating expenses such as taxes, insurance and maintenance. Always confirm that the quoted NOI includes them and a management fee, because some listings leave them out.

Is a cap rate enough to decide on a purchase?

No. Cap rates do not reflect leverage or future cash flows. Use them to compare similar assets, then check cash-on-cash return, a stressed cash-flow projection and the quality of local management.

Sources

Property Manager vs. Self-Management: Which Is Right for Your Rental?

Self-management keeps the management fee in your pocket but costs you hours, and it puts every legal and maintenance decision on you. A property manager costs roughly 8% to 12% of collected rent plus a few add-on fees, and in return takes over the daily work. The right choice depends on how much your time is worth, how many units you own, how far you live from them, and how comfortable you are with landlord-tenant law. This guide puts real numbers on each side so you can decide with a calculator instead of a hunch.

Aubenrealty
Spend Less Time Managing Rentals
Auben Realty provides property management, renovation, and tenant placement services for owners seeking less hands-on rental ownership.

Explore property management

TL;DR

  • Professional management in the US typically runs 8% to 12% of collected rent, with a national average near 8.49%, plus leasing, setup and renewal fees.
  • Self-managing owners often spend 8 to 12 hours a month per rental on core tasks, and far more during turnovers or emergencies.
  • Self-management makes sense for one or two nearby, simple properties and an owner with flexible time. Past roughly five to ten doors, informal processes tend to break.
  • The costliest self-management mistakes are legal: fair housing violations and botched evictions.
  • Whichever route you pick, put the numbers and the duties in writing before you commit.

Table of Contents

What each option actually means

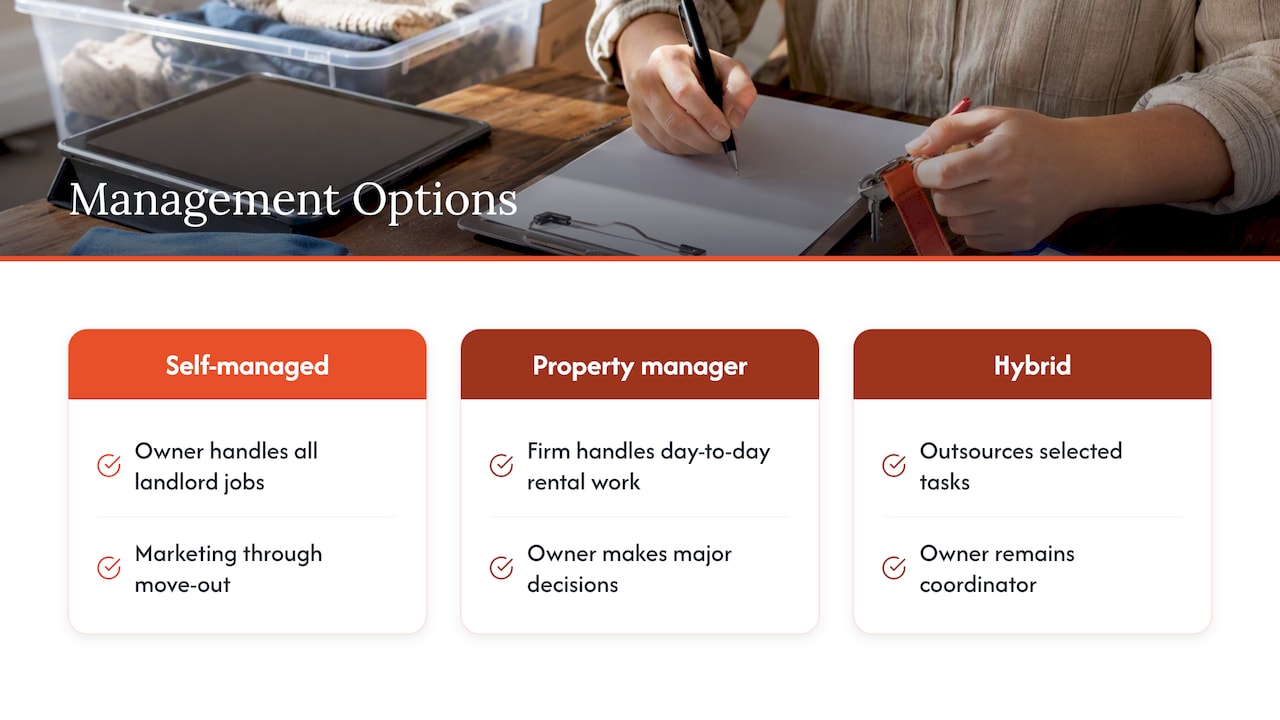
Self-management means you do every landlord job yourself: marketing the unit, screening applicants, signing the lease, collecting rent, answering repair calls, arranging contractors, handling renewals and running the move-out. The UK’s National Residential Landlords Association describes the same split: property management is the day-to-day running of a rental, and self-managing is doing all of it yourself, from marketing to check-out inspections. The rules differ by country, but the workload is the same.

Hiring a manager hands that work to a firm. In the US, a property manager is typically the tenants’ primary point of contact and handles lease management, maintenance coordination, rent collection and financial reporting on the owner’s behalf. You still own the asset and make the big calls, such as selling, major capital spending or changing rent strategy, but you stop being the person who gets the 9 p.m. call about a dead water heater.

There is also a middle path. Some owners self-manage the relationship but hire out single tasks: a leasing agent to fill a vacancy, a handyman network for repairs, an accountant for bookkeeping. That can work, but you remain the coordinator, so the time cost does not disappear.

What each option actually means

What professional management costs in the US

The monthly fee is only the headline. Industry research from iPropertyManagement puts the average monthly management fee at 8.49% of rent, with a nationwide range of about 6% to 10%. Steadily’s cost guide describes the typical range as 8% to 12% of collected rent. Percentages run higher on low-rent properties and lower on multifamily buildings, because a manager needs a minimum amount of revenue to cover the work.

On top of the monthly fee, owners may see:

A worked example

Take a single-family rental that brings in $2,000 a month and is occupied all year, with a manager charging the national average of 8.49%:

Item Math Cost
Monthly management fee $2,000 × 8.49% $169.80
Annual management fees $169.80 × 12 $2,037.60
One tenant placement fee (50% to 100% of one month) $1,000 to $2,000 $1,000 to $2,000

In a year with a turnover, the all-in cost can land around $3,000 to $4,000 before any setup fee. That is real money against a rental that may net a few hundred dollars a month. It is also the price of not doing a leasing cycle and twelve months of rent collection and repair coordination yourself. Your own figures will differ, so ask every firm you interview for a written fee schedule that lists every charge, not just the monthly rate.

What self-management costs in time

Self-management has no line item on your statement, which makes it feel free. It is not. One decision guide estimates that US self-managing landlords often spend 8 to 12 hours a month on core rental tasks, rising sharply during turnovers, late-payment cycles and maintenance emergencies. A property management calculator cited by Hemlane found averages of 47.5 hours for leasing and 46.6 hours for management per rental property. Treat those as indicators, not guarantees: a newer, well-maintained home with a long-term tenant will take far less, and an older duplex with a revolving door will take far more.

Here is a simple way to price your time. Estimate the hours you would really spend in a year, including the unpleasant ones, and multiply by the hourly value you place on your time. If 10 hours a month at $50 an hour comes to $6,000 a year, the $2,037.60 management fee in our example looks very different. If you value the time at $15 an hour and enjoy the work, self-management wins on cost. The point is to run the comparison honestly, not to assume one side always wins.

Two more costs hide in the time column. The first is the learning curve: a first-time landlord prices a unit by guesswork, writes a lease from a template and learns local rules from mistakes. The second is the mental load of being on call. Many owners say that is the real reason they hire out.

Vacancy, turnover and rent performance

The strongest financial argument for a manager is not saved time but shorter gaps between tenants. A 2024 trend survey summarized by Steadily reported an average 4-week vacancy for managed properties versus 4.6 weeks for self-managed ones. The difference is small, and the survey is one data point, but even a few days matter: at $2,000 a month, each vacant week costs roughly $460 in lost rent.

What drives faster lease-ups is boring and repeatable: pricing against current local comparables, professional photos, same-day showing responses, and a turnover process that gets the unit rent-ready quickly. A clean, well-presented unit helps too, and turnover cleaning guidance is worth reading if you handle prep yourself. If you want to dig into this side, our own guides on tips for minimizing vacancy rates and reducing your rental vacancy rate walk through the tactics.

Cleaner prepares a rental bedroom for leasing

Professional management can also limit repair overpayments. A manager with established vendors and a maintenance coordinator can usually get faster, cheaper service than an owner calling a contractor for the first time. Whether that offsets the fee depends on the portfolio, which is why the next section matters.

Money and time get the attention, but legal exposure is where self-management goes wrong in expensive ways. One property management firm’s analysis lists fair housing violations, with average settlements of $10,000 to $50,000, and botched eviction procedures that can cost months of lost rent among the common pitfalls for self-managing landlords. It is a company blog, so read the figures as a rough scale rather than a statistic, but the risk itself is real.

The federal Fair Housing Act applies to small landlords as well as large firms. Among other duties, housing providers must make reasonable accommodations in rules and policies when needed for people with disabilities, and may allow a requested physical modification on the condition that the renter restores the interior afterward, where that is reasonable. Advertising wording, screening criteria and how you answer an inquiry can all create exposure. Our guide to fair housing for landlords covers what the law requires in plain terms, and our walkthrough of tenant screening shows how a consistent process reduces risk.

Eviction, security deposit handling, required notices and habitability standards are set by state and local law, so they differ between Texas, Florida, South Carolina and Missouri. If you self-manage, read your own state’s landlord-tenant statutes and consider a short consultation with a local landlord-tenant attorney before you write your first lease. If you hire out, confirm that the manager knows your state’s rules and carries the appropriate licensing and insurance there.

Taxes: the fee is usually deductible

Hiring a manager does not have to hurt as much as the sticker price suggests. According to the IRS guidance on rental real estate, rental owners can deduct ordinary and necessary expenses for managing, conserving and maintaining the property, such as advertising, insurance, maintenance and utilities. Improvements are different: they are recovered through depreciation over time rather than deducted at once. The IRS also publishes a full guide to residential rental property with the detail. Ask your tax professional how your management fees and any leasing fees should be reported on your return.

Pros and cons side by side

Factor Self-management Professional management
Direct cost No management fee Typically 8% to 12% of collected rent, plus leasing and other fees
Your time Often 8 to 12 hours a month per rental, more in emergencies Mostly owner reporting and approvals
Control Every decision is yours Shared, defined by the management agreement
Vacancy Depends on your marketing and speed Established marketing and screening systems
Legal compliance You carry the learning curve Manager applies a standard process
Scalability Strains past a handful of units Built to handle more doors
Distance Hard if you live far away Local presence on your behalf

For a more detailed list, see our breakdown of the pros and cons of using property management and the benefits of hiring a property management company.

How to decide: six questions

Owners should weigh available time, the location and complexity of their properties, portfolio size, and whether systems or a professional can support operations. Turn that into six questions:

  1. Do you live close enough to respond in a day? A rental an hour away, or in another state, makes self-management much harder.
  2. How many units do you own, or plan to own? The same source notes that beyond five to ten properties, inconsistent processes start breaking. If you are building a portfolio, you need systems either way.
  3. What is your time worth, and what would you rather do with it? Use the hourly math above.
  4. How thin is your margin? If a $170 monthly fee turns a profitable rental into a loss, price the rent, financing or property before blaming the manager.
  5. How comfortable are you with fair housing, notices and evictions? If the honest answer is not very, the legal risk alone may justify a professional.
  6. Is the property simple? A newer single-family home with a stable tenant is far easier than an older multi-unit building needing constant maintenance.

If you answered yes to one and two, have flexible time and a simple property, self-management is a reasonable choice, especially while you learn the business. If you answered no to distance, own several units or are building a portfolio, professional management usually pays for itself in time and risk.

What to put in a management agreement

If you hire a manager, the contract matters as much as the rate. The National Apartment Association stresses that a formal management agreement optimizes the owner-manager partnership by defining deliverables, financial responsibilities and the thresholds above which the owner must approve spending. In practice, check for:

  • The exact fee schedule: management percentage, leasing fee, renewal fee, setup fee, inspection fee and any maintenance markup.
  • A repair approval limit, for example the dollar amount a manager can spend without calling you.
  • How and when rent is deposited to you, and how often you get statements.
  • Who selects vendors and how bids are handled.
  • Termination terms: notice period, any cancellation fee and who keeps tenant files.
  • Responsibilities for seasonal services. In snowy markets, for instance, snow removal contract essentials such as liability and response times should be spelled out rather than assumed.

If you want a second opinion on what owners typically ask before signing, read our answers to common questions owners have about property management.

Perspective: where we see owners get this wrong

We manage rentals across Charleston and Columbia, SC, the Dallas-Fort Worth area, Houston, Kansas City and Overland Park, and Jacksonville, and the owners who struggle most are rarely the ones who chose the wrong model. They are the ones who never priced their own time, or who hired a manager without reading the fee schedule and repair approval terms.

Our view is simple. Self-management is a legitimate choice for a small, local, simple portfolio, and we would rather you choose it knowingly than hire us out of anxiety. Once you add doors, distance or a plan to build wealth through investing, systems become the product. That is why we run a pod-based team structure, keep maintenance in house, select vendors transparently and put effort into retaining good residents, since a stable tenant is the cheapest vacancy fix there is. We combine local market knowledge with an investor mindset, so the goal is long-term return, not just a filled unit.

— MediaBeast

When Auben Realty fits

If you have decided that your time or risk tolerance is better spent elsewhere, we can take on the work. Our property management service covers leasing and tenant placement, rent collection, maintenance and resident relations, and we also support owners with renovation oversight, asset management and brokerage when they buy or sell. Fees are specific to each property and market, so we quote them after learning about your rental.

Aubenrealty

Investors who are building a larger single-family, multifamily or build-to-rent portfolio can look at our multifamily and build-to-rent services or asset management. If you simply want to see how the market looks for your property before deciding, talk to us through our home page.

FAQ

Is it cheaper to self-manage a rental property?

On paper, yes, because you avoid the fee, which is typically 8% to 12% of collected rent. In practice, you pay with your time, and costly mistakes in leasing, maintenance or compliance can erase the savings. Compare the annual fee with your realistic hours and the risk you carry.

How many properties can I self-manage?

There is no fixed limit, but one decision guide says processes tend to break beyond roughly five to ten properties. Distance and property age matter as much as the count. Two older units in another city can be harder than six newer ones nearby.

Is a property management fee tax deductible?

Ordinary and necessary expenses for managing and maintaining a rental are generally deductible under IRS guidance, and management costs commonly fall into that group. Improvements are treated differently and are depreciated. Your accountant can confirm how to report your own fees.

Can I switch from self-management to a manager later?

Yes, and many owners do once they add a property or move away. Review your lease files, gather tenant contact details, and agree with the new manager on how existing tenants will be transitioned. Read the new agreement’s start date and fee terms carefully.

Sources

Emergency Maintenance Protocol for Rental Properties

An emergency maintenance protocol is a written, repeatable process that tells everyone involved what to do in the first minutes, hours and days after a serious problem is reported at a rental: who answers, how the issue is ranked, who gets dispatched, what is recorded and how the case is closed. The goal is simple. Protect people first, stop damage second, and leave a paper trail that holds up with the tenant, the insurer and, if it comes to it, a court. Below is the protocol we recommend, with the reasoning behind each step.

Aubenrealty
Take Emergency Response Off Your Plate
Auben Realty provides property management, renovation, and tenant placement services for owners seeking less hands-on involvement.

Explore property management

TL;DR

  • Define in writing what counts as an emergency: fire, gas or electrical failure, any water leak or sewage backup, no heat or air conditioning, and unsecured entry are the standard categories.
  • Run every report through the same five steps: intake, triage, dispatch, documentation, follow-up.
  • Life-safety hazards (gas smell, fire, electrical hazard) go to 911 or the utility first, never to a vendor first.
  • Photos, timestamps, written acknowledgements and invoices make up the close-out file that protects you with insurers and tenants.
  • Review the plan at least once a year and keep backup contacts and backup communication channels.

Table of Contents

What counts as a maintenance emergency

The line between “urgent” and “emergency” is where most protocols fail. If everything is an emergency, vendors charge after-hours rates for a dripping faucet and your team stops trusting the label. If too little is, a tenant sits without heat in January.

The National Apartment Association lists fire, electrical or gas failure, any water leak or sewage backup, no heat or air conditioning, and unsecured entry among maintenance emergencies. That is a sound starting list. Adapt it to your climate and your building types, and put the final version in the lease or the resident handbook so tenants and staff read the same definition.

A practical three-tier split

Most managers find it easier to use three tiers rather than a yes/no test:

Tier Examples Target response
Emergency Gas smell, fire or smoke, exposed or sparking wiring, active water leak, sewage backup, no heat in freezing weather, no cooling in extreme heat, broken exterior door lock or window Immediate action, same hour
Urgent Water heater out, refrigerator failure, a single toilet down in a multi-bath home, a leak that is contained Same day or next morning
Routine Dripping faucet, sticking door, cosmetic damage, a burned-out bulb Scheduled within normal service windows

The response targets are our working standard, not a legal figure. Your lease, local code and your management agreement set the real obligations, so write them down before you need them. For a deeper look at how routine and emergency work differ, see our guide to the three kinds of maintenance a rental will need.

What does not belong on the emergency list

A lost key at 2 a.m. when the home is otherwise secure, a pest sighting, a noisy appliance and a slow drain are inconvenient, not dangerous. Say so in the handbook. Tenants appreciate knowing what will wait until morning, and it keeps the after-hours line free for real emergencies.

The five-step emergency protocol

Government and industry guidance converge on the same skeleton. A city housing handout on rental response describes a defined intake process, triage to categorize urgency, timely acknowledgement of the tenant’s report and thorough close-out documentation as the marks of a professional protocol. We turn that into five steps.

Five stages of emergency maintenance response

Step 1: Intake through one dedicated channel

Tenants should never wonder where to report an emergency. Publish one number for after-hours emergencies, give it to every resident at move-in, and put it on a card near the electrical panel or the water heater. Routine requests go through the portal; emergencies go by phone, because a person can ask questions and hear urgency in a voice.

The same guidance calls for a dedicated, consistent intake channel. Consistency matters more than sophistication. A single line that is always answered beats three channels that are sometimes checked.

Whoever answers should collect:

  1. The caller’s name, address and unit, and a callback number.
  2. What is happening, in the tenant’s words, and when it started.
  3. Whether anyone is in danger or hurt.
  4. Whether the tenant can safely do anything to limit damage (see the tenant steps below).
  5. Whether anyone will be home to give access.

Acknowledge receipt right away and restate the problem back, ideally by text or email as well as on the call. That written restatement is the first entry in your record.

Step 2: Triage by risk to safety and property

Triage is a short decision, not an investigation. The housing handout recommends an objective system that categorizes reports by risk to safety or property and puts life-safety hazards first. In practice, ask three questions in order:

  1. Is anyone in danger right now? A gas smell, smoke, a fire, a person trapped or sparking electrical equipment means the tenant leaves and calls 911. Utilities such as DTE Energy tell customers who suspect a leak to leave the area immediately and call 911 from a safe place, then the gas company. Your dispatch comes after that, not before.
  2. Is the property being damaged right now? Active water is the classic case. Every hour of flow adds to the repair bill, so the first priority is stopping the source, then the repair.
  3. Is the home unsafe or unlivable? No heat in freezing weather, no cooling in dangerous heat, no working exterior lock or no running water all qualify even if nothing is actively being destroyed.

Remote triage often resolves the first move. A tenant who is told where the shutoff valve is can stop a leak before a plumber is on the road, and a tripped breaker is sometimes the whole story. Do not push tenants into anything unsafe. If a task involves a gas appliance, a flooded electrical panel or standing water near outlets, the answer is to stay clear and wait for a professional.

Step 3: Dispatch the right vendor

Match the trade to the problem: a licensed plumber for a burst supply line, an electrician for a hot outlet or failed panel, an HVAC technician for a heat failure, a locksmith or board-up crew for a compromised entry, a restoration company for significant water. The housing handout stresses coordinating repairs with qualified vendors rather than improvising a fix.

Two things make dispatch fast under pressure:

  • A ranked vendor list per trade. Keep a primary and at least one alternate for each. IREM’s planning guidance calls for listing response teams, communication procedures, emergency contacts, contractors and alternates in a property-specific plan.
  • A spending authority. Decide in advance how much a manager can approve without calling the owner, and write it into the management agreement. An owner who cannot be reached at 1 a.m. should not delay a shutoff.

Tell the tenant what is happening: who is coming, roughly when, and whether they need to be home. Rapid communication of repair status is part of the protocol, not a courtesy. Your phone tree should also have a fallback. Guidance for property managers recommends consistent, calm communication channels and a backup system if primary equipment fails.

Our own approach to vendor choice is covered in how a property management company handles maintenance requests.

Step 4: Document everything as it happens

Documentation is the step that gets skipped when the crisis feels over, and it is the one that matters most months later. One rental-software blog notes that landlords often focus only on the physical fix, when immediate documentation is equally critical for insurance and legal protection.

A complete close-out file includes:

  • The original report with date and time.
  • The written acknowledgement and your restatement of the issue.
  • Photos and video of the condition before, during and after the repair.
  • Vendor dispatch time, arrival time and completion time.
  • Access logs showing who entered the home and when.
  • The invoice and proof of payment.
  • Every message to the tenant and owner.

The city handout asks for timestamps and photos, written acknowledgement and a close-out file with requests, invoices, access logs and photos. If insurance is involved, IREM advises documenting the event, response, impacts, communications, recovery and expenses and filing claims according to the insurer’s own process. Read the policy’s notice requirements before an event, not after.

Invoices deserve their own discipline. A clean invoice shows labor, parts, trip charges and after-hours premiums line by line; we explain what to look for in what a maintenance invoice should show.

Step 5: Follow up and close the loop

Emergency repairs are often temporary. A plumber stops the leak and leaves; a drywall crew and a moisture check still have to follow. The protocol should end with a follow-up that confirms the repair addressed the underlying cause, not just the symptom.

A good close-out checklist:

  1. Call or message the tenant within a day or two and ask whether the problem is truly resolved.
  2. Schedule any permanent repair work and give the tenant a date window.
  3. Review the cause. A recurring clog points to a line problem; a second heat failure points to an aging system.
  4. Update the owner with a short summary, the cost and any recommendation.
  5. Add the lesson to the plan if the process stumbled.

Repeat failures are expensive in another way too. We have written about how repeat repairs put lease renewals at risk.

What tenants should do first

A good protocol includes the tenant’s part. Put these steps in the move-in packet and repeat them in a short text when a report comes in.

  1. Get safe. For fire, smoke, a gas smell or an electrical hazard, leave the home and call 911 from outside. Do not turn switches on or off or use a phone inside if you smell gas.
  2. Stop the source if it is safe. For a water leak, close the nearest shutoff valve. Individual valves are usually under sinks and behind toilets, and a unit’s main valve is commonly near the water heater or where the supply line enters the home. Stay away from standing water near outlets and appliances.
  3. Call the emergency line, not the portal. Give the address, what happened and whether you are safe.
  4. Photograph the damage. Take pictures of the source and affected belongings before moving things where you can do so safely.
  5. Confirm in writing. A short text or email after the call creates a timestamp and avoids disputes later.
  6. Give access. Let the vendor in or arrange access ahead of time.

Tenants also carry duties. Under Massachusetts rules, for example, tenants are responsible for keeping the unit sanitary and notifying the landlord of major damage immediately, and that principle shows up in most leases. If you want help keeping the home in good shape between emergencies, share our tips on getting tenants to care for a rental home.

Water emergencies and the 24 to 48 hour window

Water is the most common and most costly emergency, and speed decides the outcome. The EPA says that drying the home and removing water-damaged items is the most important step in preventing mold, and that if things cannot be dried within 24 to 48 hours, you should assume mold growth.

For your protocol, that means:

  • Dispatch a restoration crew with drying equipment the same day for anything beyond a small, contained spill.
  • Record moisture readings and photos at the start and end of drying.
  • Do not mix cleaning products. The EPA specifically warns against combining bleach and ammonia, and says to get qualified professional help when cleanup may be too difficult or dangerous.
  • Fix the water source completely before closing walls.

If mold appears or the tenant reports health symptoms, treat it as a new case with its own triage and documentation, and involve a qualified professional rather than a handyman.

Emergency response is not only good practice. It is tied to your duty to keep the home habitable, and that duty varies by state and sometimes by city.

At the federal level, HUD’s training materials describe typical landlord responsibilities: making repairs soon after a work order, repairing or replacing large systems and appliances, maintaining plumbing and heating, and ensuring code compliance. State law adds the detail. New York, for instance, implies in residential leases a warranty that the premises are fit for human habitation and protect against conditions materially affecting tenants’ health and safety. Massachusetts regulations require owners to meet habitability standards and take immediate steps to restore essential services such as utilities and water.

Those are examples, not a universal rule. If you own in South Carolina, Texas, Missouri, Kansas or Florida, check your state’s landlord-tenant statute and any local housing code, and ask a local real estate attorney how your lease should describe emergency response times. A written protocol that you actually follow is also your best evidence that you acted promptly.

Your legal footing as a landlord — overview diagram

Preparing before the emergency happens

The cheapest emergency is the one that does not occur, and the second cheapest is the one you rehearsed.

  • Write a property-specific plan and update it yearly. IREM recommends creating a plan for each property, updating it at least annually and communicating it to affected parties.
  • Label shutoffs. Tag the main water valve, the gas shutoff and the electrical panel, and photograph their locations for the file.
  • Inspect on a schedule. Water heaters, supply lines, HVAC filters, smoke detectors and roof penetrations are where emergencies start. Our fall maintenance checklist is a good seasonal template, and routine maintenance is what keeps the emergency list short.
  • Winterize and cool-proof. Know which homes have exposed pipes, old HVAC systems or attic equipment, and service them before the hardest weather.
  • Track equipment and work orders in one system. Even a simple maintenance management list helps teams see what has been serviced, what is due and who did it.
  • Automate the repetitive parts. Acknowledgement texts, vendor reminders and status updates are good candidates, and property management automation is worth reviewing for what to tackle first.
  • Run a tabletop drill. Once a year, pick a scenario such as a Saturday-night pipe burst and walk through the five steps with staff and vendors. Gaps show up fast.

Perspective: what 15 years of managing homes has taught us

We have managed 2,700 properties across 10 regional markets, and the pattern repeats: emergencies rarely fail because of the repair. They fail because of the first thirty minutes, when nobody is sure who owns the problem, or because the paperwork was never done.

That is why we organize our teams in pods, so a small group knows the homes, owners and residents in its area. It is also why we keep maintenance in-house and select vendors transparently. When something goes wrong, the person who answers should already know the property, the tenant and the right tradesperson, and the owner should see exactly what was done and what it cost.

Our view on owners who self-manage: the protocol matters more than the phone number. Write it, share it with your tenants, and rehearse it. If you cannot staff a response around the clock, hand the process to someone who can. Fewer surprises mean better resident retention, and retention is where long-term returns come from.

— MediaBeast

How Auben can take emergency response off your plate

If you would rather not carry the phone at midnight, our property management service covers maintenance coordination, vendor dispatch and the documentation described above for single-family, multi-family and build-to-rent homes across our markets. Investors who want the numbers behind recurring repairs can pair it with our asset management work. To talk through your portfolio, start at aubenrealty.com.

Aubenrealty

FAQ

What qualifies as a maintenance emergency?

The National Apartment Association lists fire, electrical or gas failure, any water leak or sewage backup, no heat or air conditioning, and unsecured entry. In short, it is anything that threatens safety, makes the home unlivable or is actively damaging the property. Put your own list in the lease so tenants and staff agree.

What are the steps of an emergency maintenance protocol?

Intake through a dedicated channel, triage by risk, dispatch of a qualified vendor, documentation of the timeline, photos and invoices, and a follow-up to confirm the root cause was fixed. Communication with the tenant runs through all five steps.

How fast should a landlord respond to an emergency?

There is no single national number. HUD describes landlords as making repairs soon after a work order, and state and local codes set the specifics. Many managers aim to act within the hour on true emergencies. Check your state’s statute and your lease, and ask a local real estate attorney if you are unsure.

Should a tenant call 911 or the landlord first?

For fire, smoke, a gas smell or an electrical hazard, leave and call 911 first, then notify the property manager. For a contained problem such as a leaking pipe, call the emergency maintenance line right away and shut off the water if it is safe to do so.

How do I reduce emergency repairs in my rentals?

Inspect on a schedule, service major systems before each season and replace aging equipment before it fails. Keep a written plan, update it at least once a year and rehearse it with your vendors.

Sources

Rental Portfolio Management: How to Run Many Rentals as One Business

Rental portfolio management is the practice of running all your rental properties as a single investment, not as a pile of separate landlord jobs. It covers the daily work of leasing, maintenance and rent collection, but it adds a second layer: deciding which properties to improve, hold, refinance or sell, and how much risk sits in any one market, tenant base or property type. This guide shows how that works, which numbers matter, and when it makes sense to bring in a full-service manager.

Aubenrealty
aubenrealty.com
Run Rental Operations with Less Hands-On Work
Auben Realty provides property management, renovation, and tenant placement services for investors managing rental properties.

Explore Auben Realty

TL;DR

  • Property management keeps each home rented and in good repair. Portfolio management decides where your capital should sit across all of them.
  • Track a small, standard set of numbers for every property: net operating income, occupancy, expense ratio and return on equity.
  • Review the whole portfolio at least once a year and sort every asset into keep, improve, refinance or sell.
  • Outside management usually pays off when properties are far away, turnovers overlap, or your time is worth more than the fee.
  • The best setup splits the work: a manager runs operations, and you (or an asset manager) steer strategy.

Table of Contents

What rental portfolio management actually means

One rental is a task list. Ten rentals are a business. The difference is the kind of decision you make.

With a single property, you ask: is the tenant paying, is the roof sound, is the rent right? With a portfolio, the questions change. Which of these ten assets earns the least on the equity trapped in it? Are three of them exposed to the same employer, the same flood zone or the same insurance market? Should the next dollar go into a renovation, a down payment on a new door, or paying down debt?

Research from a property analytics publisher describes this shift well: portfolio management makes capital-allocation and exposure decisions across assets, rather than judging each property only on its own. That is the core idea. Property-level work feeds the portfolio, and portfolio-level thinking tells you what the property-level work should aim for.

Property management vs. portfolio management

Property management Portfolio management
Focus One building or home at a time All assets as one investment
Typical questions Who pays late? What needs repair? Which asset underperforms? Where is risk concentrated?
Time horizon Days to months Years
Typical owner of the task Property manager Investor or asset manager
Output Leases, work orders, monthly statements Hold, improve, refinance or sell decisions

Most owners need both layers. Small landlords do both themselves. Larger investors usually delegate the first layer and keep the second.

What a rental management company does for you

Before you can manage a portfolio, the operations underneath it have to run smoothly. A rental management company can price and market the property, vet tenants, collect rent, handle emergency repairs, send monthly reports and tax documents, and make property visits.

Two of those items deserve a closer look because they shape portfolio results more than owners expect.

Tenant selection. One bad placement can erase a year of profit. Consistent, documented screening criteria are what protect your occupancy and your reserves. If you want to see what that process looks like in practice, our guide on how a property management company handles tenant screening walks through it.

Maintenance. The National Association of Realtors notes that maintenance satisfaction is likely the greatest driver of overall renter satisfaction. Satisfied renters renew, and renewals are the cheapest way to protect cash flow, because you skip vacancy, turnover work and new leasing costs.

The numbers that run a portfolio

A portfolio is only manageable if every property reports the same way. Comparing a duplex in one city to a single-family home in another is meaningless unless both are measured on common benchmarks. Standardized reporting and shared benchmarks are exactly what the research on portfolio-level management points to, with the usual measures being net operating income (NOI), occupancy, expense ratios and portfolio exposure.

Here is a practical dashboard, one row per property:

Metric What it tells you Question to ask
NOI Income after operating expenses, before debt service Is it trending up or flat while rents rise?
Occupancy Share of time the unit is rented How long does each vacancy last, and why?
Expense ratio Operating costs as a share of income Which property spends more than its peers?
Return on equity Annual cash flow plus appreciation and principal paydown, divided by equity Could this equity earn more elsewhere?
Exposure Share of the portfolio in one market, type or tenant group What happens if this one area weakens?

We go deeper on the operating side in our post on key factors investors need to track for their rental properties, including how reporting should look from your manager.

Why return on equity gets overlooked

Most landlords watch cash flow and ignore equity. Yet a home you bought years ago may have grown substantially in value, which means a large amount of your money is parked in a property earning a modest rent. Ranking assets by return on equity makes that visible. One investor-education source advises ranking properties by return on equity at least once a year to decide which to keep, refinance or sell. The annual rhythm is the useful part: it turns a vague feeling about “the weak one” into a list.

Turnover is a portfolio metric, not a nuisance

If one property shows high expenses and long vacancies, look at turnover first. Short-term and vacation rentals make this most obvious, because every guest change needs a clean, a restock and an inspection. Dependable cleaning crews keep days-vacant down, and local services such as Vilano Beach turnover cleaning show the kind of vendor support that helps separate a property that is truly underperforming from one that is simply poorly turned over.

Keep, improve, refinance or sell

Once the numbers are on one page, each asset gets one of four labels. At the portfolio level, management involves capital allocation decisions such as which properties to improve, hold or sell, along with exposure and risk across markets and tenants.

Keep. Strong NOI, stable occupancy, reasonable return on equity. Leave it alone and keep the service steady.

Improve. Decent location but rents below the neighborhood, or expenses inflated by deferred maintenance. A targeted renovation can lift rent and cut repair calls. Oversight matters here: scope, bids and schedule need a single accountable party. Our project management service exists for that reason.

Refinance. High equity, low return on that equity, and a property you still like. Pulling equity out can fund the next acquisition, but run the debt service against realistic rents first.

Sell. Chronic underperformance, concentrated risk, or a market you no longer want to be in. We cover the logic of selling single-family rentals in The SFR Exit Playbook.

A worked example

Imagine a portfolio of five single-family rentals. Four earn a solid return on the equity in them. The fifth was bought long ago, has appreciated considerably, and rents for only a modest amount. Cash flow looks fine, so the owner never questions it. On a return-on-equity ranking, it sits last by a wide margin. Selling it, and moving the proceeds into a newer property or into paying down higher-rate debt, may increase total income without adding a single tenant. The numbers are illustrative, but the pattern is common, and it only shows up when you rank every asset side by side.

Before you sell any rental, talk to a CPA. Rental income generally has to be reported, and rental expenses are generally deducted in the year paid, while depreciation is recovered over a prescribed period, according to the IRS’s Publication 527 (2019 edition; check the current edition for your tax year). If you ever use a rental unit personally, expenses must be divided between rental and personal use, which can limit what you deduct. Depreciation also matters at sale, so get the tax picture before you list.

Growing a portfolio without losing control

Growth changes what is hard. A common progression runs from one or two properties (learning), to three to five (standardizing), to six to ten or more (managing a business). The bottleneck moves from knowledge, to your time and cash, to financing limits and portfolio quality.

That has practical consequences:

  1. Build repeatable systems early. Use the same lease, the same screening criteria, the same vendor process and the same reporting for every unit. Systems are what let a portfolio grow without growing your workload at the same pace.
  2. Review concentration and insurance. Several properties on one street, one flood zone or one employer’s payroll act like one big bet. Check coverage and exposure at least annually.
  3. Plan financing before you need it. Conventional loans have limits on how many mortgages one borrower can carry. Investors near those limits often look at DSCR or portfolio loans, so talk to a lender before the next purchase, not after you find the deal.
  4. Know the law where you invest. The NAR advises investors to research their market and understand state and federal legal requirements for landlords. Rules on deposits, notices and fair housing differ from South Carolina to Texas to Florida to Missouri and Kansas.
  5. Diversify deliberately. Mixing property types or sub-markets can smooth results, but only if each addition passes the same numbers test as the rest.

One real-estate glossary describes the move from ground-floor management to a bird’s-eye view as necessary for scaling, because it brings in higher-level decisions such as 1031 exchanges and risk reduction. A tax adviser should confirm whether an exchange fits your situation.

If you are weighing single-family against larger assets, our posts on whether single-family rental investing is a good idea and on build-to-rent management lay out the tradeoffs.

When professional management makes sense

Self-managing is a legitimate choice for a small portfolio nearby. Several signals suggest it has stopped being the best one. Investors are advised to consider professional management when properties are far from home, turnovers frequently overlap, or the time spent exceeds the opportunity cost of hiring help. Missed legal deadlines, such as notice periods, are another sign that the system has outgrown you.

When you compare options, use these criteria:

  • Scope. The NAR suggests reviewing company ratings and looking for agencies that offer comprehensive services to cover all operating needs. Gaps mean you end up hiring a second vendor.
  • Fees in writing. Get at least three quotes and ask for the complete fee schedule: management, leasing, renewal, maintenance markups and renovation charges. Compare total annual cost, not only the headline percentage.
  • Reporting. Monthly statements, year-end tax documents and a consistent format across every property.
  • Maintenance model. Ask who does the work, how vendors are chosen, and how fast emergencies are answered.
  • Fit for your strategy. A manager who understands investors will talk about NOI and renewals, not just rent collection.

Our perspective: manage the portfolio from both ends

We have spent more than 15 years managing and investing in residential real estate, and we have served 2,700 properties across 10 regional markets. The pattern we see most often is an owner who is excellent at finding deals and exhausted by running them.

Our view is that operations and strategy should be separate jobs with separate owners. Operations should be quiet: a team that knows your properties, answers residents fast, and reports in the same format every month. We organize that work in pods, so a focused group serves each set of properties, and we keep maintenance in-house where we can, because speed and cost control on repairs drive both resident satisfaction and renewals. Vendor selection should be transparent, so you can see why a contractor was chosen and what was paid.

Our perspective: manage the portfolio from both ends — overview diagram

Strategy, meanwhile, should be loud. It should be a regular conversation about which assets to hold, improve or sell, based on numbers and local market knowledge, not on instinct or sentiment. That is why we pair day-to-day management with asset management and brokerage: the same team that sees a property’s repair history and rent trend can tell you honestly whether it still deserves your capital. For more on how we think about it, read Built by Investors, for Investors.

The goal is not to remove you from your investments. It is to make sure your attention goes to the few decisions that move returns.

— MediaBeast

How Auben can run the operations layer

If your portfolio has reached the point where operations eat the hours you would rather spend on strategy, our property management team handles leasing, tenant placement, maintenance and reporting for single-family, multifamily and build-to-rent homes in Charleston and Columbia, SC; Fort Worth, Dallas-Fort Worth and Houston, TX; Kansas City and Overland Park; and Jacksonville and Jacksonville Beach, FL.

Aubenrealty

For the investment side, our asset management service helps you review performance across properties, and our brokerage services support buying and selling when a review says it is time to move. Investors building larger holdings can start with our multifamily and build-to-rent services. Pricing is scoped to your portfolio, so contact us for a quote through aubenrealty.com.

A simple annual portfolio review

You do not need special software to start. Once a year, set aside an afternoon and do this:

  1. Pull twelve months of income and expense statements for every property.
  2. Calculate NOI, occupancy, expense ratio and an estimated return on equity for each.
  3. Rank the properties by return on equity.
  4. Mark each one keep, improve, refinance or sell, and write one sentence on why.
  5. Check concentration: how much of your income depends on one market, one property type or one insurance region?
  6. Set one goal for the next twelve months, such as raising renewals, trimming expenses at the weakest asset, or funding one acquisition.

Repeat it every year, and your decisions will rest on a record, not a memory.

FAQ

What is rental portfolio management?

It is the practice of managing all your rental properties as one investment. That includes operating each home well, but also comparing assets on common metrics, allocating capital among them and controlling risk across markets and tenants.

What does a rental management company do?

A management company typically markets and prices the rental, screens tenants, collects rent, handles repairs and emergencies, and sends monthly reports and tax documents. Many also make periodic property visits. Exact services and fees vary, so ask for the full list and fee schedule in writing.

How many rentals before I should hire a manager?

There is no magic number. The better test is whether distance, overlapping turnovers or missed deadlines are costing you money, or whether your hours are worth more elsewhere. Many owners hire help somewhere between a handful of properties and ten, but one distant property can justify it sooner.

Which metrics matter most for a rental portfolio?

Start with NOI, occupancy, expense ratio and return on equity for each property, then look at exposure across the whole portfolio. Measure every property the same way so you can compare them fairly.

Sources

Rental Renovation Management: A Practical Owner’s Guide

Rental renovation management is the work of running a renovation on an income property as a business project. You set a measurable goal, build a budget with a cushion, hire and supervise licensed trades, follow the safety and tax rules, keep tenants informed, and get the unit leased on a date you chose in advance. Done well, it protects your return. Done badly, a “quick refresh” turns into months of vacancy. This guide walks through each stage in the order the work actually happens.

Aubenrealty
Manage Rental Renovations With Less Stress
Auben Realty provides property management and renovation services for owners seeking expert support with their investment properties.

Visit Auben Realty

TL;DR

  • Start with a number, not a mood board: pick one outcome (higher rent, lower vacancy, fewer maintenance calls) and judge every line of scope against it.
  • Budget bottom-up, add a contingency, count soft costs, and schedule backward from the date you want the unit leased.
  • Verify contractor licenses, insurance and references, and put scope, timeline and payment terms in writing.
  • Pre-1978 housing brings federal lead-safe work rules and disclosure duties, and your city’s codes and permits apply on top.
  • Improvements and repairs are taxed differently, so decide which is which before the work starts, with your tax professional.

Table of Contents

What renovation management covers on a rental

On an owner-occupied home, a renovation is a personal project. On a rental, it is a capital decision with a payback period, a tenant (or an empty unit costing you rent every day) and legal obligations attached. Managing it means owning six things at once:

  1. Goals and scope: what you are trying to achieve and what is in or out.
  2. Budget and schedule: the money, the sequence of trades and the lease-up date.
  3. Vendors: who does the work, under what contract, and who checks it.
  4. Compliance: permits, codes, lead-safe practices and disclosures.
  5. Residents: notice, access and, in occupied buildings, disruption.
  6. Financial review: what it cost, how it is treated for tax and what it returned.

Owners who live far from the property, hold several units or simply do not want a second job usually hand this coordination to a property manager. We cover that option further down. First, the stages.

Step 1: Set goals you can measure

The most common renovation mistake is starting with finishes. Start with the outcome. Forbes Business Council contributors make the same point about the repair-or-renovate decision: define the project’s primary purpose first, whether that is code compliance, attracting tenants, cutting maintenance calls, raising rent or repositioning the property, and then weigh cost against likely rent, utility, maintenance and retention benefits.

Turn that purpose into a figure you can check afterward:

  • “Raise rent by a set amount per month on this unit.”
  • “Cut turnover days from the last move-out to the next move-in.”
  • “Eliminate the plumbing leaks that generated repeat work orders.”
  • “Reduce utility costs the tenant or the owner pays.”

A goal with a number lets you say no to scope creep. If a granite countertop does not move the number, it does not go in the plan.

Think in systems, not isolated upgrades

The U.S. Department of Energy’s homeowner guidance recommends a whole-house approach: consider how changes interact across the building’s systems, and choose measures that together improve efficiency, comfort, durability, health and safety. On a rental, that means you do not install new windows over a wet wall, or new flooring before you have dealt with the plumbing leak that will ruin it. Fix the envelope and the systems first, finishes last.

Run the numbers on a capital-needs basis

Federal housing programs give a useful model even if you never touch one. HUD’s guidance on capital-needs assessments describes documenting the property’s condition, current and future repair and replacement needs, estimated costs, and immediate work tied to life or health threats, code violations, lower operating costs, indoor air quality and competitiveness. You can borrow the structure for a single-family rental: list what must be fixed now, what will fail within a few years, and what is optional. Then decide whether to do one larger rehab now or a smaller one now plus bigger reserves later.

Step 2: Choose the scope that fits the property

Popular renovations for rentals tend to repeat: kitchen refreshes, bathroom updates, flooring, paint, curb appeal, in-unit laundry hookups and smart locks. We go through the list, with a view on which ones tend to pay off, in our guide to the best renovations for your rental property and in a separate piece on green upgrades that pay back.

The filter that matters more than the list is the property itself. Over-renovating is a real risk: a finish level that exceeds what comparable rentals in the neighborhood offer will not necessarily earn back its cost. Check three things before you commit:

  • Property size and style. A 900-square-foot bungalow and a four-bedroom family home attract different renters with different priorities.
  • The neighborhood. Walk or browse what is leasing nearby and at what rent.
  • Competing listings. If every comparable unit has in-unit laundry and yours does not, that is a gap worth closing. If none do, it may be a luxury.

If you want a renter’s-eye view of the choices that make a single-family home easier to lease, see our post on making your home more appealing to renters.

Two practical rules for scope:

  • Do the highest-return item first. If money or time runs short, you want the part that earns rent already finished.
  • Be wary of moving plumbing. Relocating a sink, toilet or laundry hookup changes walls, floors and sometimes permits. Keeping fixtures where they are is one of the cheapest ways to protect a budget.

Step 3: Build a budget that survives surprises

A rental renovation budget has hard costs and soft costs, and owners usually forget the second group.

Cost type Examples
Hard costs Demolition, materials, labor, appliances, fixtures, paint, flooring
Soft costs Design or drawings, permits, inspections, dumpsters and hauling, utilities during work, insurance, marketing the finished unit
Carrying costs Mortgage, taxes and insurance while the unit is empty, plus rent credits or temporary housing if residents are displaced
Contingency A reserve for what the walls reveal once opened

Build it bottom-up: a written scope of work, a unit cost for each line, then a contingency on top. As a starting point we would carry a smaller cushion on cosmetic work in a newer home and push toward the high end of the range on older structures or anything involving plumbing, electrical or structure, where surprises live. Whatever you pick, decide it before bids arrive so it does not quietly shrink under pressure.

Exterior items deserve their own line because they are large and often urgent. If a roof is in the plan, a property manager’s guide to reroofing projects can help you think through how a big exterior job fits into the rest of your budget and schedule.

Schedule backward from the lease date

Pick the date you want the first tenant to move in, then work backward: final clean, final inspection, punch list, paint, flooring, fixtures, rough-in trades, demolition. Add buffer days for inspections and material delays. Every week of slippage on a vacant rental is a week of lost rent plus carrying costs, which is why the calendar belongs in the budget conversation. For a clear picture of the end of that timeline, our rental turn process guide shows how the finishing steps fit together.

Renovation schedule from demolition through move-in

Step 4: Hire and manage contractors

Most renovations that go wrong do so at the contractor stage. The fundamentals are unglamorous and they work:

  • Verify license and insurance with your state or local licensing board and the insurer, not just a certificate handed to you.
  • Check references and recent work, ideally rentals or properties of similar age.
  • Get at least three written bids against the same scope, so you compare like with like.
  • Use a written contract covering scope, timeline, payment schedule and what happens with change orders.
  • Tie payments to milestones, not to the calendar.
  • Hold regular check-ins and send a written follow-up after each one, so there is one record of schedules, decisions and changes.

Low bid is not the same as low cost. A contractor who underbids and then writes change orders for everything costs more than a fairer bid with a complete scope.

Why in-house coordination helps

Trades have to arrive in order, and one missed handoff (the painter before the drywall has dried, the flooring crew before the plumber is finished) costs days. Property managers who keep their own maintenance staff and a vetted vendor bench can shorten those gaps. That is the model we run: in-house maintenance, transparent vendor selection and a team structure built so the same people follow your project from bid to turnover.

Step 5: Stay on the right side of safety rules, codes and permits

This is where an owner can get into real trouble, so be specific.

Lead-safe work in pre-1978 housing

The EPA’s Renovation, Repair and Painting rule requires that anyone paid to disturb painted surfaces in housing built before 1978 be certified and use lead-safe work practices. The rule applies to firms of every size, including sole proprietors, and in general does not cover homeowners working on their own homes. A landlord’s rental is not their personal residence, so hire a lead-safe certified contractor for any pre-1978 rental where the work will sand, cut or demolish painted surfaces, and ask to see the firm’s certification before signing.

Disclosure is a separate duty. Federal law requires landlords of pre-1978 housing to disclose known lead-based paint information before the lease takes effect, a point the City of Wichita’s landlord and tenant handbook spells out in plain terms. We cover the details in two posts: what property managers need to know about lead paint disclosure and what managers and tenants need to know about lead paint.

Lead-safe work in pre-1978 housing — overview diagram

Local codes, permits and entry notice

Building and housing codes are local. The same Wichita handbook notes that Kansas landlords must comply with city and county building and housing codes, and that entry to a tenant’s home should follow reasonable notice, with 24 hours’ written notice recommended as good practice. Your market will have its own rules. Before demolition, call your city or county building department and ask which parts of your scope need a permit and inspection. Plumbing, electrical, structural changes and roofing commonly do. A contractor who suggests skipping a permit is handing you their risk.

We operate across Charleston and Columbia, SC; Dallas-Fort Worth and Houston, TX; Kansas City and Overland Park; and Jacksonville, FL. Permit thresholds, inspection timelines and licensing differ between them, which is why local knowledge matters more than a generic checklist.

Step 6: Keep tenants informed and disruption low

Empty-unit renovations are simpler. Occupied ones, such as exterior work, a shared-building system replacement, or a unit renovated at renewal, need a communication plan. HUD’s multifamily guidance for occupied rehabilitation involving relocation illustrates the standard: plans must cover tenant needs, notices, schedules and relocation support. Private owners are not bound by those programs, but the structure is sound for anyone:

  1. Give written notice early, with the scope, start date, expected duration and who to call.
  2. Set work hours and keep them.
  3. Protect belongings and common areas, and tell residents how dust, water shutoffs and noise will be handled.
  4. Give one point of contact who answers quickly.
  5. Offer remedies when the work is truly disruptive, such as a rent credit or temporary housing, and document what you agreed.
  6. Confirm completion in writing and invite a walkthrough.

When a renovation ends in a move-out, clearing the unit is part of the job. A landlord cleanout checklist helps you plan removal of left-behind furniture and debris so the crews can start on schedule. If the project will also change rent, give the tenant your pricing news properly: see our tips on telling tenants about rent increases and on raising rent without losing tenants.

Step 7: Decide whether it was worth it

Before you spend, estimate the return. A simple frame: expected monthly rent lift multiplied by the months you expect to keep the unit leased at that rent, plus any savings in vacancy and maintenance, minus total project cost including soft and carrying costs. If the answer is thin, shrink the scope or skip the project. The Department of Energy’s guidance also suggests comparing projects by expected return in time and money, including payback from energy savings.

After you spend, track actuals against the budget and the goal you set in step 1. That record makes the next renovation cheaper to plan.

Repair or improvement: the tax difference

The IRS draws a line between repairs and improvements. Per IRS Publication 527, expenses that result in a betterment to your property include fixing a pre-existing defect or condition and enlarging or expanding the property. Improvements are generally capitalized and recovered over time. For residential rental property, the recovery period is 27.5 years, while ordinary repairs that keep the property in its current condition are generally deductible when incurred. A kitchen gut and a patched faucet are taxed very differently. Because rules and elections can change and your facts matter, ask a CPA who handles rental real estate to classify the project before work begins.

Our perspective

In our experience managing single-family, multifamily and build-to-rent homes across ten regional markets, renovations rarely fail on design. They fail on coordination: a scope nobody wrote down, a vendor chosen on price alone, a lease-up date that nobody owned. That is why we organize around pods, small teams that stay with your property, and why we keep maintenance in-house and select vendors transparently. When the same people who will lease and manage the home also supervise the work, decisions get made with the tenant and the rent roll in mind.

We also push owners to renovate less, not more. The best return often comes from fixing what drives complaints and vacancy and leaving the rest. Our job is to make sure that when you do spend, it is aimed at the goal you set.

— MediaBeast

When to bring in a manager

You can run all of this yourself, and plenty of owners do. A manager makes sense when the property is far away, when you own several units, when the work involves occupied homes, or when you simply want a single accountable team. Our project management service covers renovation oversight: scoping, bids, vendor supervision and getting the unit rent-ready. Pair it with property management and the same team leases the finished home and handles it afterward. Investors weighing larger renovations and repositioning plans can look at our asset management work, and if you are building a portfolio, our multifamily and build-to-rent services apply. To talk through a specific property, start at aubenrealty.com.

Timing matters too. Finishing before the busy leasing months gives the unit its best chance of renting quickly, which is the subject of our notes on leasing season.

A pre-renovation checklist

Before signing any contract, confirm each of these:

  • One written goal with a number attached.
  • A scope of work listing every item, in order.
  • A budget with soft costs, carrying costs and a contingency.
  • Three bids against the same scope.
  • License, insurance and (for pre-1978 work) lead-safe certification verified.
  • Permits identified with your local building department.
  • A tenant notice and access plan, or a confirmed vacant unit.
  • A target lease date with buffer days.
  • Your CPA’s view on repair versus improvement.

FAQ

What is the 2% rule for rentals?

The 2% rule is a rough screening shortcut: monthly rent should equal about 2% of the purchase price. It is a quick filter, not an underwriting method, and it ignores taxes, insurance, repairs and vacancy. In many markets few homes meet it, so use it to sort listings and then run the full numbers, including any renovation cost.

What is the 50% rule for rental property?

The 50% rule is a rough estimate that operating expenses, excluding the mortgage, will consume about half of the rent over time. It is meant for quick comparisons. A freshly renovated property may run below that early on, while older homes with deferred maintenance can run above it.

How much contingency should a rental renovation have?

There is no official figure, but you should always hold a reserve. A lighter cosmetic refresh can carry a smaller cushion, while older homes and projects touching plumbing, electrical or structure call for a larger one. Set the percentage before you collect bids and treat it as untouchable except for true surprises.

Do I need a licensed contractor for a rental renovation?

Usually yes for anything involving electrical, plumbing, structure or roofing, and licensing rules vary by state and city. For pre-1978 housing, paid work that disturbs painted surfaces requires a lead-safe certified firm under EPA rules. Check with your local building department and licensing board before hiring.

Sources

Overland Park Rental Market: Rents, Vacancy and Demand

The Overland Park rental market is steady, tight and expensive for its region. Apartments typically list in the high $1,000s to low $1,500s per month depending on the source, single-family houses ask well above $2,000, and the city’s own housing study shows a renter vacancy rate near 5% and a long gap between the homes it needs and the homes it is building. This guide gives the numbers, explains what sits behind them, and shows what they mean whether you are renting or owning a rental.

Aubenrealty
aubenrealty.com
Manage Your Overland Park Rental
Auben Realty provides property management, renovation, and tenant placement services for owners seeking less hands-on involvement.

Explore property management

TL;DR

  • Rent figures for Overland Park vary by source and property type. Apartment averages cluster around $1,400 to $1,550 a month, and houses average about $2,200.
  • The city’s housing study puts renter-occupied vacancy at 5.2% and counts 38.5% of households as renters.
  • Overland Park has permitted about 696 homes a year in 2020 to 2024, against a stated need of 1,420 a year through 2030, which supports rents.
  • Owners need a city rental license, and the city inspects exteriors and common areas. Budget for property tax, licensing, maintenance and vacancy before you count profit.

Table of Contents

What renters pay in Overland Park

There is no single official rent number for the city, and the listing sites disagree because they measure different things: asking rents, new leases, apartments only, or every property type. Reading them side by side gives a usable range.

Measure Figure Source
Average apartment rent $1,548 Point2Homes
Average apartment rent, last month in a 2026 guide $1,368 Ark7 renting guide
Average house rent, same guide $2,228 Ark7 renting guide
Median rent, all property types (May 2024 snapshot) $2,038 Zillow Rental Manager

A few patterns hold across all of them.

  • Apartments sit roughly $700 to $900 below houses. A renter who needs three bedrooms, a garage and a yard pays a clear premium.
  • The range is wide. Listings run from under $1,000 for older small units to several thousand dollars for large houses, so an “average” describes few real leases.
  • Figures move month to month. The Zillow page above is a 2024 snapshot, and it is useful mainly as a reference point for how far asking rents have drifted since. Check live listings before you set a budget or a price.

If you are comparing, use the same property type and bedroom count on every site. A studio average and a three-bedroom average cannot be mixed.

How rents differ by neighborhood and ZIP code

Overland Park is large, and rents follow age of housing, proximity to employers and shopping, and school boundaries. Without a single reliable neighborhood dataset, think in broad zones rather than exact dollar figures.

  • Northern and older areas (such as the 66204 and 66212 ZIP codes). Smaller apartments, older duplexes and townhomes, and the lowest entry rents. Duplexes and townhomes with three bedrooms near the north end have been advertised at roughly $2,100 to $2,300 a month, according to one 2026 listing page.
  • Downtown Overland Park and Metcalf corridor. Walkable, mixed-use, and mostly apartments. Listing sites put the Downtown neighborhood average in the mid-$1,500s, with rentals ranging from about $1,400 to about $1,850.
  • South of 135th Street and the southern ZIP codes. Newer subdivisions, larger single-family homes, and the top of the rent range.

Prices in a given ZIP code change quickly because a handful of listings can swing the average. Thirteen active listings in one ZIP code, for example, say very little about a year of leasing.

How tight the market is

Vacancy is the best single number for how much leverage a renter or landlord has. The City of Overland Park’s Housing Needs Analysis, a January 2026 draft built on 2019 to 2023 Census estimates, reports:

  • renter-occupied vacancy of 5.2%,
  • overall vacancy of 4.8% for Johnson County,
  • a housing mix of 61.5% owner-occupied and 38.5% renter-occupied.

A vacancy rate around 5% is generally read as balanced to slightly tight. Units do not sit empty for long when they are priced to the market, but renters still have choices. Landlords who overshoot on rent tend to feel it in days on market rather than in a failed lease-up.

A caution on those figures: they are survey estimates from a multi-year window, not this month’s occupancy. They tell you the shape of the market, and your own property’s performance depends on price, condition and presentation.

What drives rental demand

Three forces show up in the city’s own analysis.

Jobs and commuting. The same study notes that housing demand reflects local needs and the chance to attract workers who commute into the city. Overland Park is one of the largest employment centers in the Kansas City metro, so it competes for renters with Kansas City, Missouri, Olathe and Lenexa.

Schools and suburban appeal. Strong school districts make families willing to rent a house for a year or two before buying, which keeps demand for single-family rentals steady.

Limited new supply. Overland Park needs to build an average of 1,420 housing units a year through 2030, but permitted an average of 696 a year from 2020 to 2024, per the same city analysis. Construction has leaned toward single-family homes and large apartment complexes, with few of the 3 to 12 unit buildings that often serve middle-income renters.

Housing need versus permitted units and demand drivers

That last point matters most for anyone planning a rental. When supply runs at roughly half of the stated need, rents rarely fall for long.

Affordability and what renters should expect

The median household income in Overland Park was $103,838 in the city’s analysis, which is high. It is also why rents are high: higher-income households compete for the same stock. The study found that 39.7% of renters were cost-burdened, meaning they spend more than 30% of income on housing, and that higher-income households were taking up some units that would be affordable to lower-income ones.

For renters, that translates into a few practical habits:

  1. Apply fast with complete paperwork. Pay stubs, ID and prior landlord contact details ready on day one.
  2. Expect income screening. Many landlords ask for gross monthly income around three times the rent. It is a common practice, not a legal rule, and requirements differ by owner.
  3. Know your credit picture before applying. Minimum credit scores for houses vary by landlord, and a larger deposit or a co-signer can sometimes offset a thin file.
  4. Compare total cost. Apartment rent often includes trash, water or amenities. A house usually adds utilities, lawn care and a pet fee.

Landlord rules and costs in Overland Park

Anyone renting out a property needs to treat the city’s rules as part of the business plan.

Licensing and inspection. A rental license is required for every rental home in Overland Park. The city’s program page lists what inspectors look at: premises identification, exterior wall surfaces, openings, roofs, stairs, decks and similar exterior conditions. Confirm the current fee and renewal cycle on the city page before you buy or list, because those can change.

Inspector checks rental home's exterior deck railing

Short-term rentals. Renting for fewer than 30 days still falls under the rental license, and the property has to meet maintenance and safety standards. Confirm current rules with the city before you plan around nightly rates.

Property tax. Effective rates in the city are reported around 1.17% to 1.22% of market value, and your bill depends on the school district’s mill levy. On a $450,000 house, that is roughly $5,300 to $5,500 a year, before insurance.

A simple profit check

Most landlords overestimate profit because they count rent and mortgage but skip the rest. A realistic monthly check for a house renting near $2,200 includes:

  • property tax and insurance,
  • a maintenance reserve (many owners set aside 5% to 10% of rent),
  • vacancy allowance (one month a year is about 8%),
  • management and leasing fees, if you hire out the work,
  • license and inspection compliance.

Run the numbers with your own purchase price and financing. Profit margins differ widely, and a property that looks strong on gross rent can be thin once these are in.

Where investors find opportunity

The supply gap points to the middle of the market. Duplexes, townhomes and small multifamily are the property types the city says it is building least of, and renters are asking for them. Some investors add leasable square footage by finishing basements in duplexes and townhomes, which can lift rent if it is permitted and done well.

Build-to-rent single-family communities are a second route, and they pair well with the strong demand for houses among families who are not ready to buy.

And owners who decide to exit have options. If you are weighing a sale rather than a hold, why landlords sell rental properties covers the common reasons, from tenant problems to repair costs, and is a useful way to test your own situation.

Our perspective: what the numbers mean in practice

We manage rentals across 10 regional markets, including Kansas City and Overland Park, and the pattern we see is that the gap between a good landlord result and a poor one is rarely the market. It is the operation.

Most vacancy loss comes from slow turns and mispriced listings, not from a lack of renters. Most surprise costs come from deferred maintenance that gets expensive. That is why we run a pod-based team structure, so each owner and resident deals with a small team that knows the property, and why we keep maintenance in-house and select vendors transparently. When the same people handle repairs, leasing and resident communication, units turn faster and residents stay longer, and retention is the cheapest way to protect return.

We also push owners to price to the local market instead of to a target number. In a market with vacancy near 5%, a few days of vacancy cost more than the extra $25 a month an aggressive price might earn.

For first-time investors, our advice is to buy to the numbers, not to the neighborhood. Know your tax, insurance, reserves and licensing costs before you make an offer.

— MediaBeast

Managing a rental in Overland Park with Auben

If you own or plan to buy a rental in the Kansas City metro and would rather not run it yourself, our property management team for Kansas City and Overland Park investors handles leasing, tenant placement, maintenance and resident retention. Buying or selling? Our brokerage services cover acquisition and sales, and our multifamily and build-to-rent services are built for investors looking at the supply gap described above. Fees are quoted per property, so ask for a proposal based on your actual home or portfolio.

For a look at how the wider metro is moving, our piece on what happens after Kansas City’s World Cup rental spike explains how short-term demand surges can cool.

FAQ

What is the average rent in Overland Park?

It depends on the property type and the source. Apartment averages typically fall between about $1,370 and $1,550 a month, and houses average around $2,200. Compare the same bedroom count and property type, and check live listings for current asking prices.

Is Overland Park a good place to invest in rental property?

The fundamentals are strong: a high median household income of $103,838, renter vacancy around 5.2%, and new construction running well below the city’s stated need. Returns still depend on your purchase price, property taxes, reserves and management costs, so underwrite each property individually.

Do I need a license to rent out a home in Overland Park?

Yes. The city requires a rental license for all rental homes, and it inspects exteriors and common areas as part of the program. Check the city’s rental licensing page for the current fee and renewal timing.

What income do I need to rent in Overland Park?

There is no citywide rule. Many landlords ask for gross income of about three times the monthly rent, plus a credit and rental history check. With a median rent above $2,000 for houses, that means roughly $6,000 or more in monthly income for many listings.

Sources