Jacksonville Cap Rates in 2026, Seen From Fort Worth
October 31, 2026
Jacksonville multifamily cap rates sit at roughly 5% to 6% in 2026, depending on class and source, while retail and industrial trade around 7%. Dallas-Fort Worth multifamily averaged about 5.2% in the second quarter of 2026. For a Fort Worth investor, that means Jacksonville pays a little more per dollar of income, but the gap is small enough that taxes, insurance, vacancy and management quality can erase it.
TL;DR
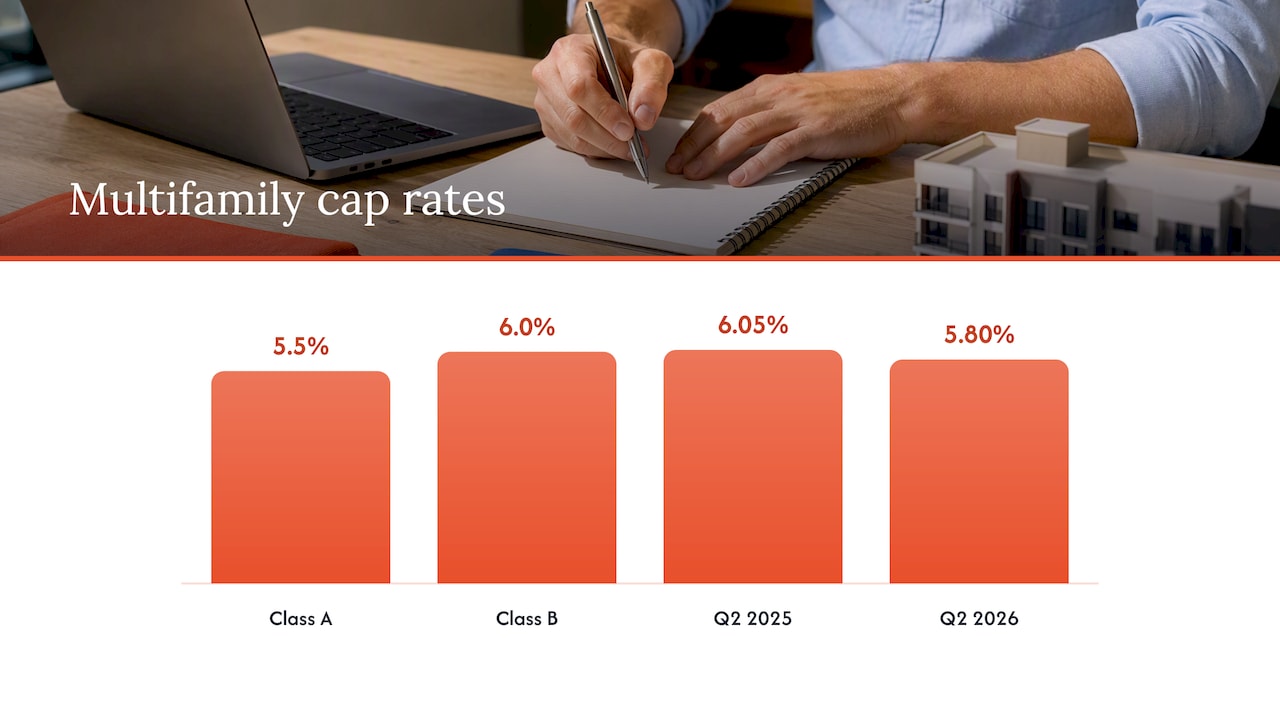
- Jacksonville multifamily cap rates cluster between about 5.5% and 6.0% for Class A and B stock, with Q2 2026 compressing to 5.80%.
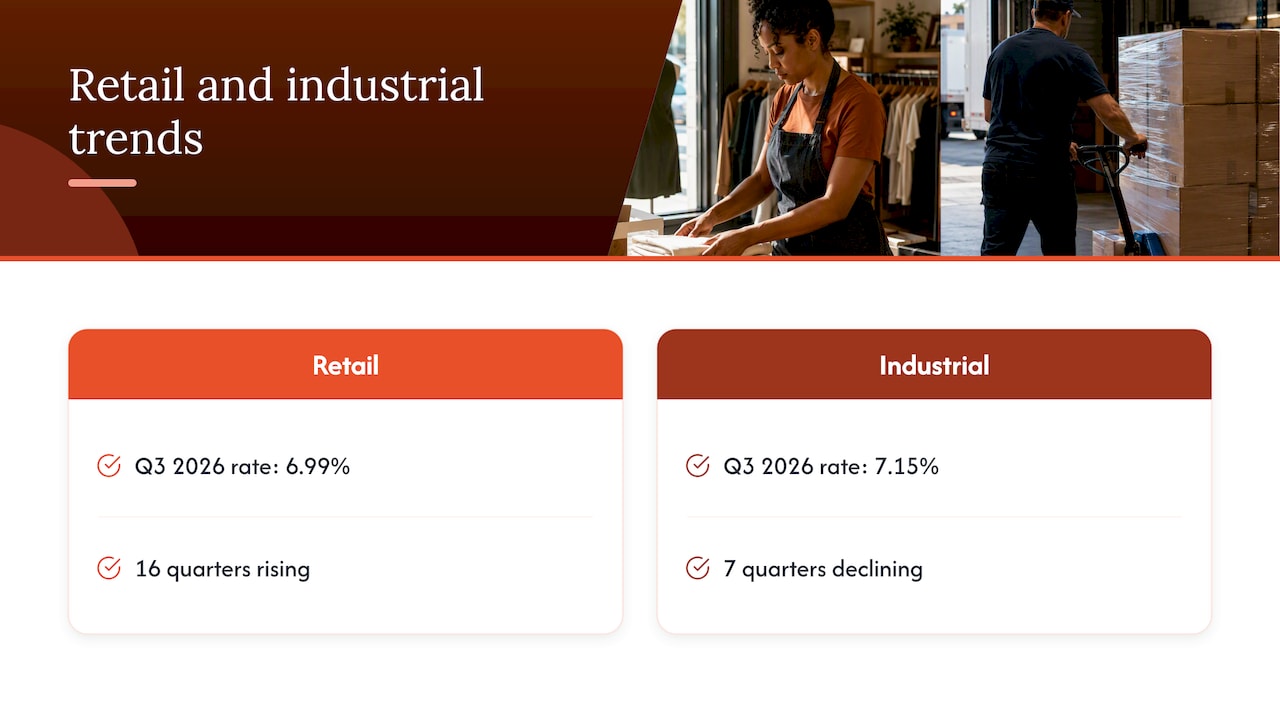
- Jacksonville retail averaged 6.99% and industrial 7.15% in Q3 2026, and the two are moving in opposite directions.
- Dallas-Fort Worth multifamily averaged about 5.2% in Q2 2026, so Jacksonville offers a modest premium, not a dramatic one.
- A cap rate ignores financing and future cash flow. Compare it with cash-on-cash return and your own expense assumptions before you buy.
- Cap rates only compare like with like: same property type, class, location and actual versus projected numbers.
Table of Contents
- What a cap rate tells you (and what it leaves out)
- Jacksonville cap rates by property type in 2026
- How Jacksonville compares with Fort Worth and Dallas-Fort Worth
- What to check before trusting any cap rate
- Cap rate versus cash-on-cash: use both
- Perspective: why we look past the headline cap rate
- Run the numbers with a local team
- FAQ
- Sources
What a cap rate tells you (and what it leaves out)
A cap rate is a property’s annual net operating income (NOI) divided by its current market value, shown as a percentage. Investopedia’s definition frames it as a way to compare the relative value of similar properties. A building that produces $120,000 of NOI and is priced at $2,000,000 has a 6% cap rate.
NOI is rent and other income minus operating expenses such as taxes, insurance, maintenance and management. It leaves out mortgage payments, depreciation and income taxes. That is why a cap rate works as a snapshot of the asset, not of your personal return.
The same source notes the limits: cap rates do not account for leverage or future cash flows, and a discounted cash flow model can be better when income is irregular. Freddie Mac’s multifamily guidance adds a useful way to think about it: a cap rate combines a return on capital (like an interest rate) with a return of capital (like recovering your principal over time).
Two practical consequences follow:
- A higher cap rate is not automatically better. It often signals more risk, a weaker location or a property that needs work.
- A lower cap rate is not automatically worse. Buyers accept it when they expect rent growth or a safer tenant base.
Jacksonville cap rates by property type in 2026
Jacksonville is a mid-sized Florida market with a port, logistics base, military presence and a growing suburban ring toward St. Johns County. Cap rates differ a lot by asset type, so a single “Jacksonville cap rate” does not exist. Here is what the 2026 data shows.
| Property type | Reported Jacksonville cap rate | Period | Source |
|---|---|---|---|
| Multifamily, Class A | 5.5% | January 2026 | Integra Realty Resources |
| Multifamily, Class B | 6.0% | January 2026 | Integra Realty Resources |
| Multifamily, overall | 5.80% | Q2 2026 | Southern Edge Capital |
| Multifamily, metro range | 5.0% to 6.0% | 2026 | MaxLife Commercial |
| Retail (average) | 6.99% | Q3 2026 | Matthews |
| NNN retail | 5.75% to 7.5% | 2026 | MaxLife Commercial |
| Industrial (average) | 7.15% | Q3 2026 | Matthews |
| Industrial, metro range | 5.5% to 6.75% | 2026 | MaxLife Commercial |
| Office | 7.5% to 9.5% | 2026 | MaxLife Commercial |
The spread between sources is itself information. An average of closed sales (like the Matthews averages) and a metro-wide range of quoted figures answer different questions. When two reports disagree by a full point on the same asset type, check their definitions before you pick a number.
Multifamily: modest spread, cautious recovery
Integra Realty Resources reported a 50 basis point spread between Class A at 5.5% and Class B at 6.0% in Jacksonville multifamily. It describes the market as in a cautious recovery, with longer transaction times but optimism for Class A assets because of their appreciation potential.
The direction matters as much as the level. Southern Edge Capital reports Jacksonville multifamily cap rates compressing to 5.80% in Q2 2026 from 6.05% in Q2 2025. Compression means prices are rising relative to income, so buyers who waited for higher rates have mostly been disappointed.
Retail and industrial: opposite trends
Matthews reports an average Jacksonville retail cap rate of 6.99% in Q3 2026, after rising for 16 consecutive quarters. Industrial averaged 7.15%, after seven consecutive quarters of decline. Retail yields are drifting up while industrial yields are coming down, so the same “commercial” label hides two different stories.
Where the rate moves inside Jacksonville
MaxLife Commercial’s market guide says the widest spreads are in Class A office and mid-tier retail, and that compression is more pronounced toward St. Johns County, the Southside and suburban corridors. It also reports that Jacksonville commercial assets typically trade 25 to 50 basis points wider than comparable assets in Orlando and Tampa. Treat these as published market observations, not guarantees for any one building.
For neighborhood-level context on rents and demand, our Jacksonville market overview and the Jacksonville rental market breakdown show what drives the income side of the formula.
How Jacksonville compares with Fort Worth and Dallas-Fort Worth
Apartment Loan Store reports that Dallas-Fort Worth commercial cap rates compressed slightly in Q2 2026, averaging 5.2% for multifamily and industrial, 6.7% for retail and 7.9% for office. Against Jacksonville:
| Property type | Dallas-Fort Worth, Q2 2026 | Jacksonville, 2026 |
|---|---|---|
| Multifamily | 5.2% average | 5.0% to 6.0% range, 5.80% in Q2 |
| Industrial | 5.2% average | 5.5% to 6.75% range, 7.15% Q3 average |
| Retail | 6.7% average | 5.75% to 7.5% NNN range, 6.99% Q3 average |
| Office | 7.9% average | 7.5% to 9.5% range |
The sources use different methods and quarters, so the table is a rough guide and not an exact comparison. Still, the pattern is consistent: Jacksonville multifamily and industrial generally price at somewhat higher cap rates than Dallas-Fort Worth, while retail and office are close.
Why a higher cap rate in Jacksonville is not free money
A premium of 30 to 80 basis points on a $2 million building is roughly $6,000 to $16,000 a year of NOI at the same price. That sounds large until you check what sits between rent and NOI:
- Property taxes. Texas has no state income tax but leans heavily on property tax. Florida’s burden differs by county. Compare the actual tax bill for each asset, not the state reputation. Our Duval property tax guide shows how to estimate it.
- Insurance. Coastal and wind exposure in Northeast Florida can change the expense line materially. Get a real quote before you underwrite.
- Distance. Owning in Jacksonville from Fort Worth means relying on someone else for leasing, maintenance and vendor oversight. That cost belongs in NOI.
- Liquidity. Depth of buyers affects how fast you can exit. IRR notes longer transaction times in Jacksonville multifamily.
If the spread vanishes after those adjustments, the cap rate was only advertising a difference that does not exist.
What to check before trusting any cap rate
JPMorganChase’s cap rate explainer recommends comparing like-kind properties by type, location, income, expenses, quality, condition and durability, and checking whether income and expenses are actual or projected. In practice, ask these questions of every listing:
- Is the NOI actual or pro forma? A trailing 12-month statement beats a broker’s projection.
- Are expenses complete? Look for a management fee, reserves, payroll and realistic repairs. Owner-managed buildings often show none of these.
- Is the rent in place or market? Below-market leases can raise the future yield, and above-market ones can lower it.
- What class and condition is the building? A Class C asset at 6% and a Class A at 5.5% are not the same risk.
- Where is it? The same JPMorganChase piece lists proximity to employment centers, highways and transit as local drivers, along with tenant quality, rent growth and lease terms.
CBRE adds a caution: during uncertain markets, investor sentiment and pricing expectations vary more, so the gap between low and high yield estimates widens, particularly in lower-class office. A single published number hides that range.
Which way are cap rates headed?
CBRE’s 2026 outlook expected cap rates for most property types to decrease by 5 to 15 basis points, with more compression for good-quality assets. In its H1 2026 survey it noted that neighborhood retail, hotel and industrial saw the most compression among property types across the eastern U.S. The same outlook says total returns will depend mostly on asset selection and management, not market-wide appreciation. That is the part you control.
Cap rate versus cash-on-cash: use both
The cap rate assumes you pay all cash. Most investors do not. Cash-on-cash return measures annual pre-tax cash flow against the cash you actually invested, so it reflects your loan, rate and down payment. A property with a 6% cap rate can produce a weak cash-on-cash return if debt costs more than the property yields.
For a clear walkthrough of when each metric is the right one, see this cap rate vs cash-on-cash comparison. We also lay out the same trade-off with local numbers in our Houston cap rate analysis, which is a useful Texas benchmark for how this works.
A simple routine for comparing a Fort Worth deal and a Jacksonville deal:
- Rebuild NOI for both using actual expenses, including a professional management fee.
- Calculate the cap rate for each on the same basis.
- Run cash-on-cash with your real financing terms.
- Stress the result: vacancy up two points, insurance up 20%, rents flat for a year.
- Pick the deal that still works under stress, not the one that wins on the headline number.
Perspective: why we look past the headline cap rate
We operate in 10 regional markets, including Fort Worth and Jacksonville, and the pattern we see is consistent: investors who compare cap rates across cities usually get the income side right and the operating side wrong.
A cap rate is only as honest as the NOI beneath it. Our approach is to pair local market expertise with investor-focused strategy, so the expense line reflects what it actually costs to run a building there: in-house maintenance, transparent vendor selection, and proactive resident retention that keeps vacancy down.
That is why we think a few dozen basis points of spread between two cities matter less than who is running the asset. A well-managed building at a 5.5% cap rate can outperform a poorly managed one at 6.5%, because turnover, deferred repairs and slow leasing quietly consume the difference.
If you are weighing an out-of-state purchase, decide who will manage it before you decide what it yields.
MediaBeast
Run the numbers with a local team
If you are comparing Fort Worth against Jacksonville, or any of our other markets, we can help you underwrite both sides with real operating costs. Our asset management team works on investor-focused strategy for single-family, multi-family and build-to-rent holdings, and our Dallas/Fort Worth brokerage covers acquisitions and sales locally.
If you already own in Northeast Florida and want fewer hands-on hours, see our Jacksonville property management page, or start from our Jacksonville market page. To talk through a specific property, get in touch with Auben Realty.
FAQ
What is a good cap rate in Jacksonville?
There is no single good number. For multifamily, 2026 reports put Class A near 5.5% and Class B near 6.0%, with overall averages around 5.8%. A good rate is one that compensates for the property’s class, location, condition and your financing, not simply the highest one on the page.
Are cap rates higher in Jacksonville than in Fort Worth?
For multifamily and industrial, published 2026 figures generally show Jacksonville a bit higher than Dallas-Fort Worth, whose multifamily average was about 5.2% in Q2 2026. Retail and office are closer. Sources use different methods, so compare the same property type and period.
Do Jacksonville cap rates include property taxes and insurance?
A correctly calculated cap rate uses NOI, which is after operating expenses such as taxes, insurance and maintenance. Always confirm that the quoted NOI includes them and a management fee, because some listings leave them out.
Is a cap rate enough to decide on a purchase?
No. Cap rates do not reflect leverage or future cash flows. Use them to compare similar assets, then check cash-on-cash return, a stressed cash-flow projection and the quality of local management.
Sources
- Capitalization Rate: Cap Rate Defined With Formula (Investopedia)
- Capitalization Rate Guidance (Freddie Mac Multifamily)
- 2026 Annual Viewpoint Jacksonville, FL Multifamily Report (Integra Realty Resources)
- Q2 Jacksonville Multifamily Intelligence Report (Southern Edge Capital)
- Jacksonville Commercial Cap Rates 2026 (MaxLife Commercial)
- Jacksonville, FL Retail Market Report Q3 2026 (Matthews)
- Jacksonville, FL Industrial Market Report Q3 2026 (Matthews)
- Cap Rates in Dallas-Fort Worth, Texas (Apartment Loan Store)
- Cap Rates, Explained (JPMorganChase)
- U.S. Cap Rate Survey H1 2026 (CBRE)
- Capital Markets, U.S. Real Estate Market Outlook 2026 (CBRE)
- Cap Rate vs Cash on Cash