Charleston Cap Rates in 2026: What Investors Should Expect
November 1, 2026
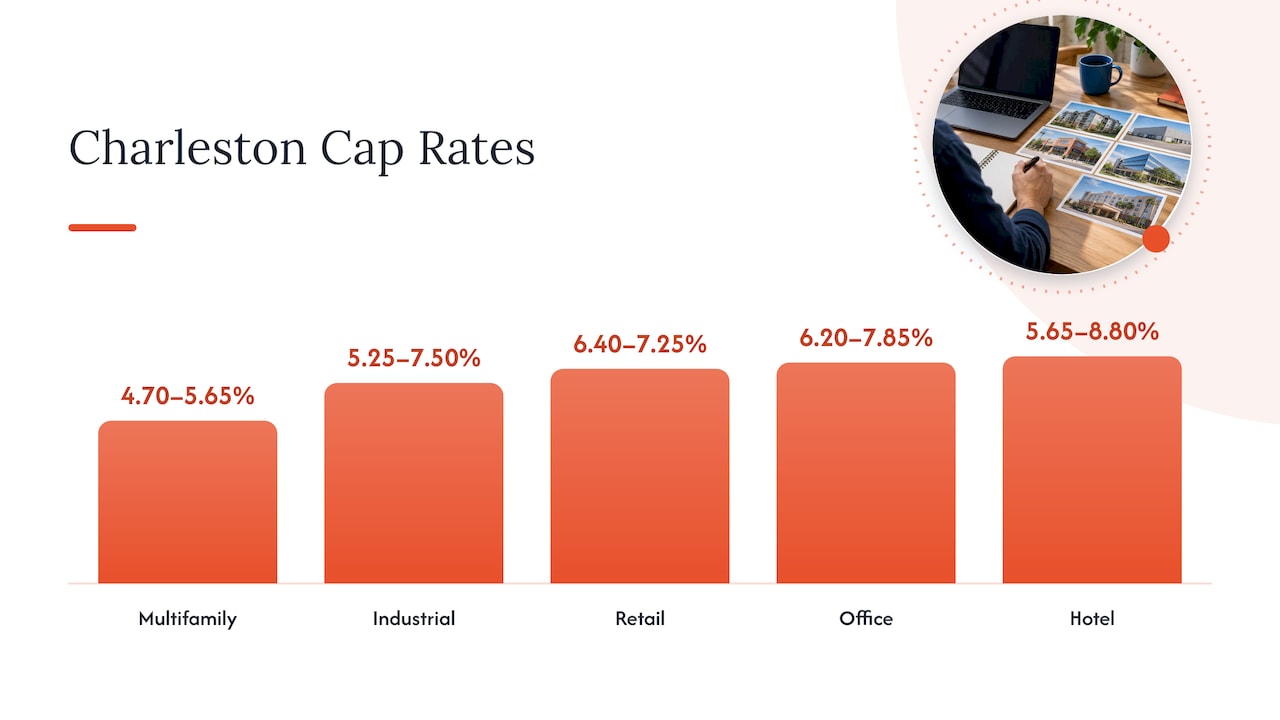
Charleston cap rates in late 2026 sit at roughly 4.70% to 5.65% for multifamily, with industrial, retail, office and hotel properties spread across a wider band of about 5.25% to 8.80%. The exact number you should expect depends on property class, location and condition, so treat any single citywide figure as a starting point for your own underwriting, not a verdict on a deal.
This guide gives you the published ranges, the formula, a worked example, and the local factors that push Charleston cap rates up or down. It is written for investors and owners deciding whether a Lowcountry property is priced fairly.
TL;DR
- A cap rate is net operating income divided by property value. It is a quick pricing yardstick, not a forecast of your return.
- As of October 30, 2026, a published lender survey puts Charleston multifamily at 4.70% (Class A, metro) to 5.65% (Class C, suburban).
- Other asset types run wider: industrial 5.25% to 7.50%, retail 6.40% to 7.25%, office 6.20% to 7.85%, hotels 5.65% to 8.80%.
- Cap rates ignore financing, so pair them with cash-on-cash return, reserves and a realistic expense budget.
- A low cap rate is not automatically a bad buy, and a high one is not automatically a bargain. Check the NOI behind the number.
Table of Contents
- What a cap rate tells you (and what it doesn’t)
- Current Charleston cap rates by property type
- How Charleston cap rates have moved
- What drives cap rates in the Lowcountry
- How to use a cap rate when you evaluate a deal
- Common mistakes with cap rates
- Perspective: why the operator matters as much as the rate
- Put the numbers to work with Auben
- FAQ
- Sources
What a cap rate tells you (and what it doesn’t)
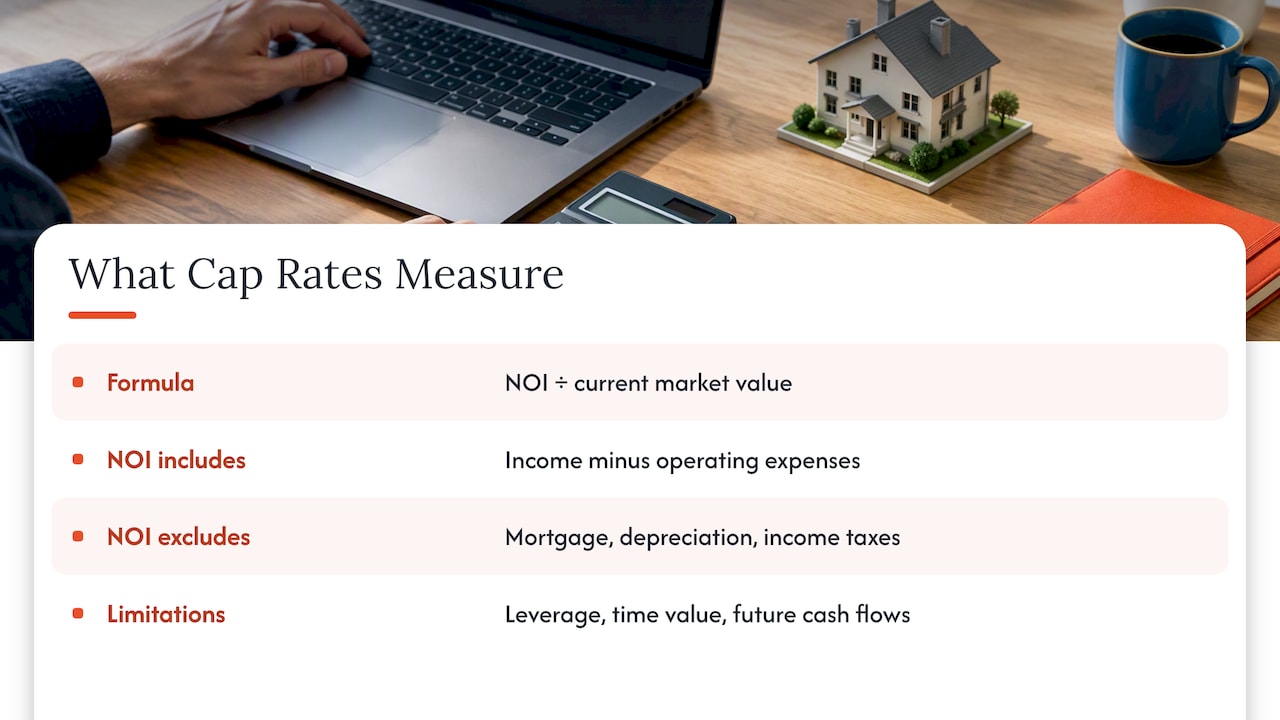
The capitalization rate estimates the annual return of an income property if you bought it with cash. You divide net operating income (NOI) by the property’s current market value. Investopedia’s definition also notes the limits: the measure does not account for leverage, the time value of money, or future cash flows from improvements, so it should not be used alone.
NOI is rent and other income, minus operating expenses: property taxes, insurance, management, maintenance, utilities you pay, and a vacancy allowance. It leaves out mortgage payments, depreciation and income taxes. That is why two investors with different loans can look at the same property and see the same cap rate but very different cash flow.
Cap rates also look forward. JPMorganChase describes them as measures that reflect investor return expectations, competition, monetary policy and local economic conditions, not a guarantee of realized returns. When you see 5% on a listing, you are seeing what the market is willing to pay for a projected income stream, and the projection is the part you have to test.
The formula with a Charleston-style example
Here is an illustration with made-up numbers, not a listing:
- A small multifamily building is offered at $1,000,000.
- Gross scheduled rent is $100,000 a year. You allow 6% for vacancy and credit loss, leaving $94,000.
- Operating expenses (taxes, insurance, management, repairs, reserves, utilities) total $38,000.
- NOI is $56,000.
- Cap rate: $56,000 ÷ $1,000,000 = 5.6%.
Now change one input. If insurance and repairs come in $8,000 higher than the seller’s pro forma, NOI falls to $48,000 and the true cap rate at the same price is 4.8%. At a 5.6% target, the price that matches your numbers is about $857,000. That one exercise is why underwriting expenses matters more than debating the headline rate.
Current Charleston cap rates by property type
The most recent published breakdown we found for the market comes from a Charleston cap rate table from a commercial lender, dated October 30, 2026. It lists these ranges:
| Property type | Published Charleston range |
|---|---|
| Multifamily | 4.70% (Class A) to 5.65% (Class C) |
| Industrial | 5.25% to 7.50% |
| Retail | 6.40% to 7.25% |
| Office | 6.20% to 7.85% |
| Hotel | 5.65% to 8.80% |
Within multifamily, the same source shows Class A at 4.70% in the metro and 4.75% in the suburbs, and Class C at 5.64% and 5.65%. The spread between A and C is under one percentage point, which tells you the market prices newer product only modestly richer than older stock.
Treat these as ranges from one survey. Cap-rate tables from different publishers, and even the same publisher at different dates, disagree by a few tenths of a point, because they sample different trades, define classes differently and update on different schedules. Before you rely on a number, confirm it against recent closed sales for similar buildings and against a local broker’s opinion of value. If a figure you read last quarter differs from the one above, that is normal movement, not an error on your part.
Multifamily and single-family rentals
Multifamily is where Charleston’s published numbers are most consistent: Class A near the high 4s, Class C in the mid 5s. Single-family rentals and small build-to-rent communities are valued less uniformly. Small investors often price a rental house by comparing it to nearby sales and by its own rent and expenses, and the resulting cap rate is whatever those inputs produce. In a market with high home values, a single-family house can show a lower cap rate than an apartment building while still appealing because of appreciation potential and tenant demand. That trade-off is a strategy decision, and cap rate alone will not settle it.
If you are weighing houses against small apartments, our write-up on turning houses for rent in Charleston into investment opportunities walks through how owners think about that choice.
Industrial, retail, office and hotel
The commercial ranges are wider because the risk differs more from one property to the next. A long-term lease to a strong tenant on a modern industrial building sits at the low end. A short-lease flex building with an uncertain tenant sits at the high end. Hotels show the widest range, 5.65% to 8.80%, because income swings with occupancy and seasonality, which matters in a tourism-driven city.
Local supply conditions explain some of the spread. A Q1 2026 market report from a flexible-space marketplace described Charleston office as stable with 7.5% vacancy, while retail was supply-constrained with projected 2026 vacancy of 3.3%. It tied the office stability to a lack of new speculative development, which pushes demand toward existing space. Tight retail supply supports rents, but the published retail cap rates still sit above multifamily, a reminder that cap rates price lease risk and tenant quality, not only vacancy.
How Charleston cap rates have moved
Charleston multifamily cap rates compressed during the low-rate years, then repriced as borrowing costs rose. A Coldwell Banker Commercial multifamily report for the Southeast region, which appeared in search results for this topic, describes A and B class cap rates holding near 5.4% and sitting well below borrowing costs, with C class rates rising as prices readjust. That regional picture matches the pattern in the table above: the gap between what a stabilized property yields and what debt costs has been thin, and buyers have leaned on rent growth and expense control to make deals work.
We would be cautious about quoting any single “Charleston history” chart. Publicly available local series are sparse, and much of the historic data sits behind paid subscriptions. A practical approach is to build your own comparison set: pull the cap rates implied by the last 6 to 12 months of closed sales in the submarket you care about, and note the trend in asking prices versus sale prices. Your broker, lender and property manager can all supply actual operating statements to back up those numbers.
What drives cap rates in the Lowcountry
National forces set the baseline. Academic work on commercial real estate pricing, including a Real Estate Research Institute study by Liang Peng, finds that credit availability, prior risk-adjusted real estate performance, lagged house-price appreciation and nonresidential construction spending are important cap-rate drivers, and that higher cap rates go with greater pricing uncertainty. In plain terms: when credit is easy and recent performance is strong, buyers accept lower yields. When money tightens, yields rise and prices adjust.
Local factors then move a property above or below the baseline:
- Location and flood exposure. Peninsula, West Ashley, Mount Pleasant, Summerville and North Charleston price differently. Flood zone status affects insurance cost, which comes straight out of NOI.
- Insurance and taxes. Coastal wind and flood coverage can be a large expense line. Non-owner-occupied property taxes in South Carolina are assessed at a higher ratio than owner-occupied homes, so a cap rate built on the seller’s current tax bill can overstate NOI after a sale reassessment. Confirm the numbers with the county assessor before you finalize your pro forma.
- Short-term rental rules. Charleston-area short-term rental regulation varies by jurisdiction and can change, so income that depends on nightly stays deserves a haircut until you have confirmed the local permit status.
- Tenant demand. Port, aerospace, healthcare, tech and military employment support rental demand. Demand supports occupancy, but occupancy only matters if rents cover a realistic expense load.
- Property condition. Deferred maintenance becomes an expense or a capital call. Roof age is a classic example: a commercial roof inspection before closing helps you decide whether the seller’s maintenance line is believable, and a roof near the end of its life is a price negotiation, not a footnote.
How to use a cap rate when you evaluate a deal
A cap rate is a screening tool. Slatt Capital’s guide to cap rates points out that a higher cap rate generally signals higher return and lower risk if you buy with cash, but that you should use it alongside other methods because projecting NOI is difficult in volatile markets. Here is a workable routine.
Step 1: Rebuild the seller’s NOI
Ignore the pro forma. Ask for 24 months of trailing operating statements, current rent roll, leases, tax bills and insurance quotes. Replace the seller’s management fee and maintenance figures with market ones. Many owner-operated properties show no management cost, which inflates NOI.
Step 2: Compare to the right set
Match class, age, size and submarket. A 1960s brick fourplex and a 2022 garden-style community do not share a cap rate even a mile apart.
Step 3: Layer on financing
If your loan costs more than the cap rate, leverage works against your cash flow until rents rise. Calculate cash-on-cash return and debt service coverage. Lenders typically want income comfortably above the loan payment, so run it before you fall in love with a property.
Step 4: Stress test
Model vacancy two points worse, insurance up 15%, and a roof or HVAC replacement in year three. If the deal still clears your minimum return, the cap rate is telling you something real.
Step 5: Think about the exit
Your sale price equals future NOI divided by the cap rate buyers will demand then. If you underwrite an exit at a lower cap rate than you paid, you are betting on market conditions, not on operations. A conservative plan assumes the exit cap rate equals or slightly exceeds the entry cap rate.
Common mistakes with cap rates
- Comparing cap rates from different dates. A figure from 2021 says little about 2026 pricing.
- Using asking rent instead of collected rent. Concessions, delinquencies and turnover reduce real income.
- Leaving out reserves. A building with no replacement reserve line is not showing you its true NOI.
- Treating the cap rate as total return. It excludes appreciation, principal paydown, tax benefits and capital improvements.
- Chasing the highest rate. A 7% cap rate on a building with a failing roof and chronic vacancy can be worse than a 5% on a stable asset.
For a closer look at screening lower-priced deals, see our post on how to find cheap investment properties and judge their ROI.
Perspective: why the operator matters as much as the rate
We look at Charleston cap rates every week, and the lesson is the same: the number on the listing is a snapshot of someone’s assumptions. The number you earn is set by how well the property is run after closing.
Across more than 15 years and 2,700 properties served in 10 regional markets, we have seen two buildings with the same purchase cap rate end up with very different yields. The difference comes from leasing speed, resident retention, maintenance cost and vendor pricing. That is why we run a pod-based team structure, keep maintenance in-house and select vendors transparently. Each of those choices is designed to protect NOI, which is the numerator in every cap rate calculation.
For investors, we recommend underwriting with operating partners at the table. A property manager who knows Charleston submarkets can tell you what a unit will really rent for, how long it will sit, and what a turn costs. Pair that with an asset management plan that sets renovation scope against the rent it can support, and the cap rate you pay becomes a floor for your return, not a ceiling.
MediaBeast
Put the numbers to work with Auben
If you are buying, selling or holding Charleston-area rentals, we can help turn a cap rate estimate into an operating plan. Our team covers property management for single-family, multifamily and build-to-rent assets, leasing and tenant placement, renovation oversight, asset management and brokerage. We will help you test a seller’s NOI against local rents and expenses before you commit.

Start with our Charleston market page or talk to us about investor-focused brokerage services. If you already own, our asset management service looks at how to raise NOI through rents, expenses and renovations. Our fees are not published online, so contact us for a scope and quote.
FAQ
What is a good cap rate in Charleston, SC?
There is no single good number. Published ranges for late 2026 put Charleston multifamily at about 4.70% to 5.65%, while other asset types run higher. A good cap rate is one that, after your own expense and vacancy assumptions, clears your financing cost and your required return with a margin for error.
Are Charleston cap rates lower than in other South Carolina markets?
Generally, coastal and high-demand markets trade at lower cap rates than smaller inland markets, because buyers accept lower yields for stronger demand and appreciation. Compare the same property class and date when you check Charleston against Columbia or Greenville, since survey methods differ.
Can I use a cap rate for a single-family rental?
Yes. Divide the house’s annual rent, less vacancy and all operating expenses, by its purchase price or value. Remember that single-family rentals are usually priced against home sales, so the cap rate is an output of price, not what drives it. Use it with cash-on-cash return and your plans for holding the property.
Does a higher cap rate mean a better investment?
Not by itself. A higher cap rate often signals higher risk, such as weaker location, older systems, shorter leases or uncertain income. It can be a good opportunity if you can fix those issues, and a trap if you cannot. Verify the NOI and the condition of the property first.
Sources
- Capitalization Rate: Cap Rate Defined With Formula (Investopedia)
- Cap Rates in Charleston, South Carolina (Apartment Loan Store)
- Cap Rates, Explained (JPMorganChase)
- Finding Cap Rates: A Property Level Analysis of Commercial Real Estate (Real Estate Research Institute)
- Guide to Cap Rates (Slatt Capital)
- Charleston Commercial Office Space, Q1 2026 (TenantBase)
- Why Commercial Roofs Need Inspections (Hytz Roofing)